- Search Energy EXCH
- 63 Results
- ponchofx replied Apr 7, 2020
I'll wait for intraday close above 1.0840 to consider longs.
EURUSD Pro
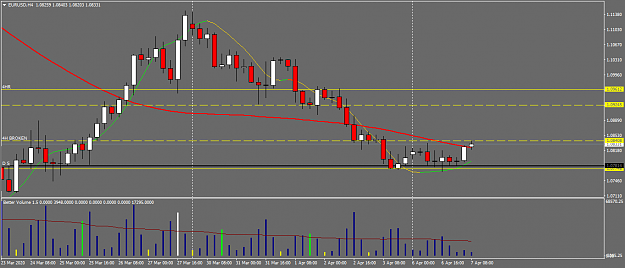
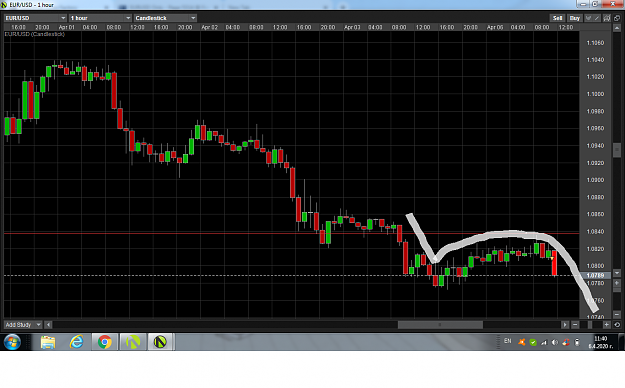
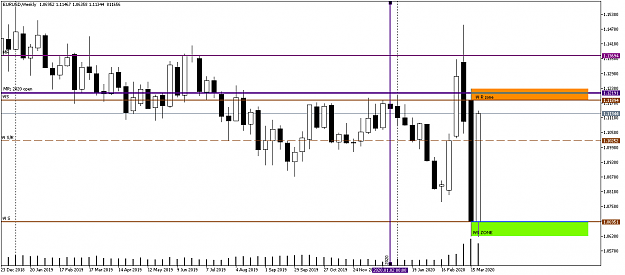
- ponchofx replied Apr 6, 2020
By the slope of the last retrace(or the absence of any) this may go in waterfall mode to 1.07 if we break the current lows. I am tempted to hold this trade.
EURUSD Pro
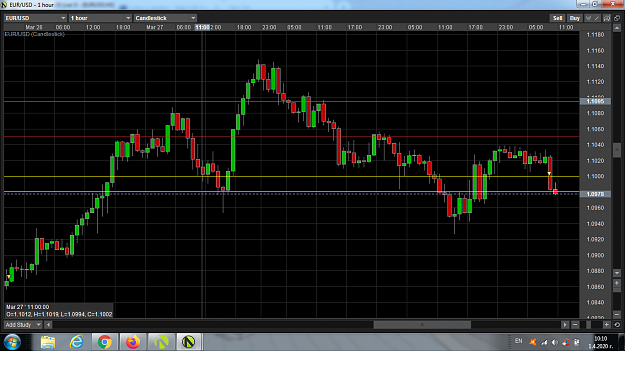
- ponchofx replied Apr 1, 2020
Lately I've been trying to spot such less random areas or sweet spots, or loopholes whatever you wanna call it. No indicators, just observing the price and how a certain level has reacted to it before and decide if it is weak and trade between such ...
EURUSD Pro
- ponchofx replied Mar 29, 2020
Excellent thread, keep it up! I also think we'll see swings either direction, we are in the midst of a liquidity crisis and volatility is high. The Fed has been interveening in the Repo market as lender of last resort since last October(which is ...
EURUSD Pro
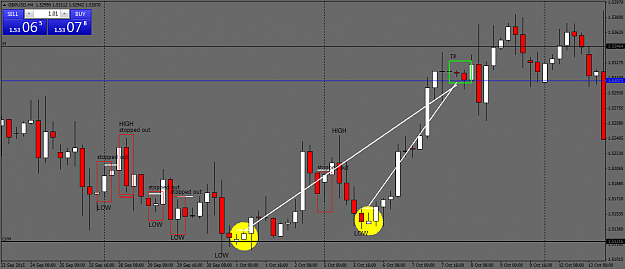
- ponchofx replied Oct 28, 2015
Thank you 60 for the wonderful video! Here's an example from a few weeks ago and I would like to know if the trades are shown right according to this method. I've picked a week with a very choppy PA to show that even in such adverse conditions this ...
Trade with 60
- ponchofx replied Sep 24, 2015
I am still in the trade from last night, I hope this sucker finally makes me some pips
Trade with 60
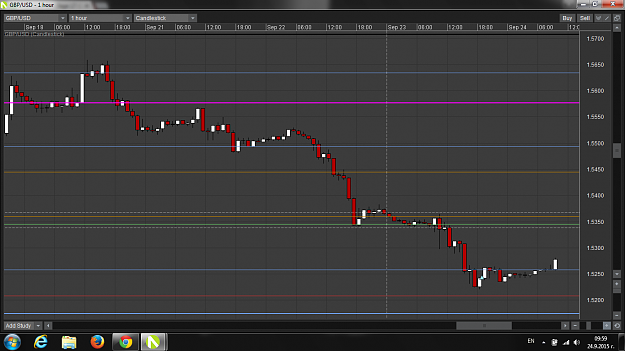
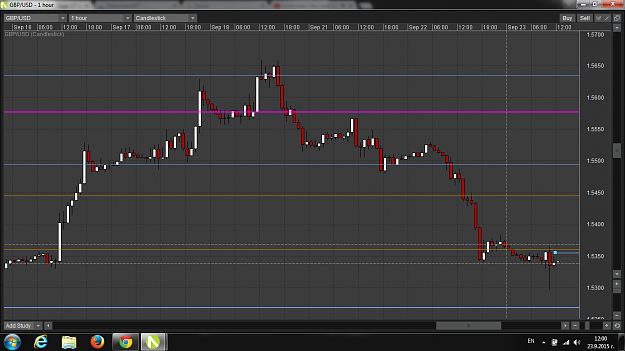
- ponchofx replied Sep 23, 2015
Thanks for the quick reply! I will consider it. Not the best day for GBPUSD, the LO bar whipped up and down making simultaneously new H&L and stopped me out just to set up another long trade. Pending order above the bullish bar, SL is a little ...
Trade with 60
- ponchofx replied Jun 26, 2015
Thank you for your reply! Yes, I'm trying to stay away from microtrading and smaller TF. I see what you mean. Basically, you mark your levels on the chart and watch the PA when P gets there Here is another chart I wanna see if I got it right. ...
Simple "Make Pips" Strategy
- ponchofx replied Jun 22, 2015
Hi Simoneg, I like your methodfor its simplicity.I have a few questions if you don't mind. Do you take set ups during slow hours or only when the market is active? You seem to prefer JPY pairs for this method but I guess anypair with enough ...
Simple "Make Pips" Strategy
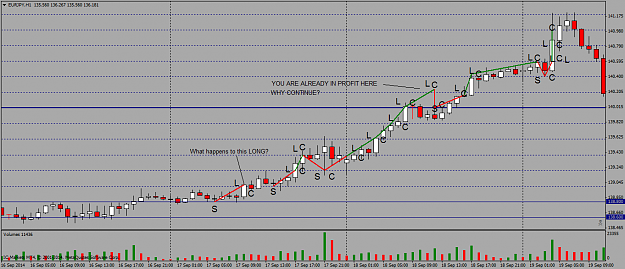
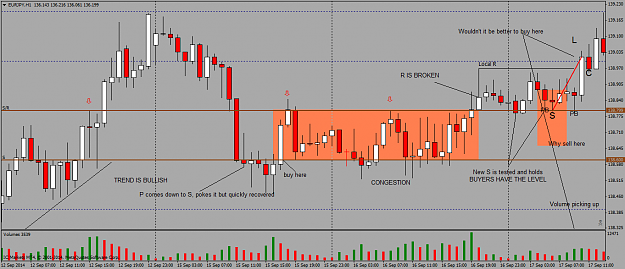
- ponchofx replied Dec 18, 2014
I'm sorry, I didn't post entries because I wanted to illustrate the hook. The best trade is when the P returns to the hook for the first time(second also works but remember the more times P returns, the weaker that S gets until it eventually ...
my system of 20 pips
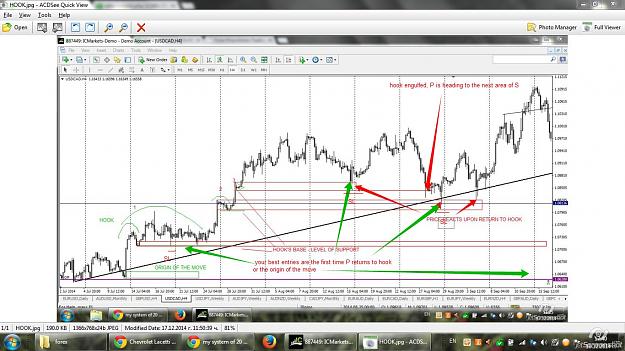
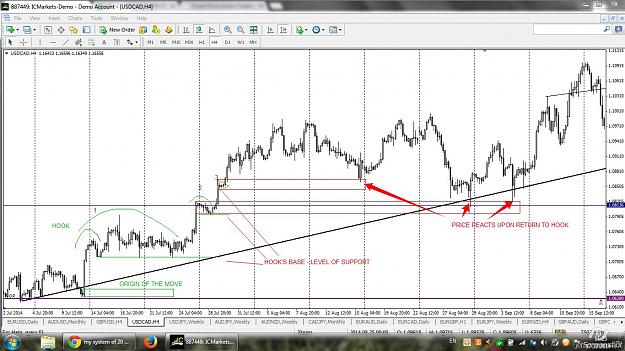
- ponchofx replied Dec 17, 2014
The hook is a very powerful price structure. I'll try to explain briefly. It happens after a strong momentum move which shows that there is imbalance between buyers and sellers. I've shown example with a bullish hook. After a pole/vertical movement ...
my system of 20 pips
- ponchofx replied Dec 17, 2014
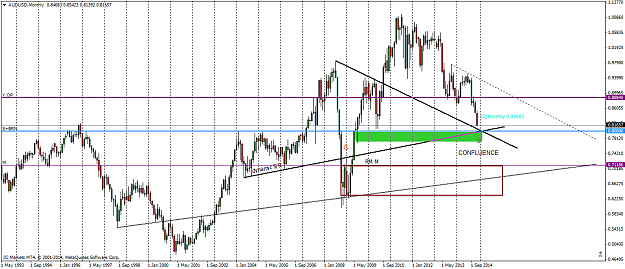
AUDUSD P is entering an area where we might expect reaction. Look at the confluence And if it closes below further downside action is expected towards old RM limits at around 0.71 image
Beyond the Candles
- ponchofx replied Dec 17, 2014
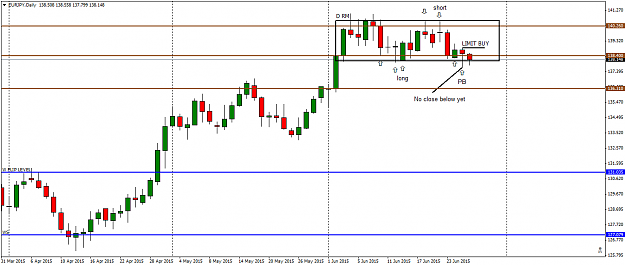
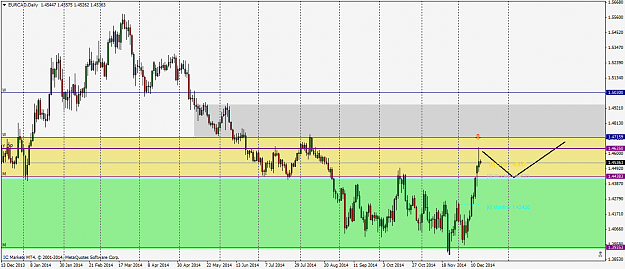
Have you guys noticed how P reacts when it reaches the yearly open price. Now look at the EURCAD- reaction of 100pips. Now waiting to see if it will test S image
Beyond the Candles
- ponchofx replied Dec 12, 2014
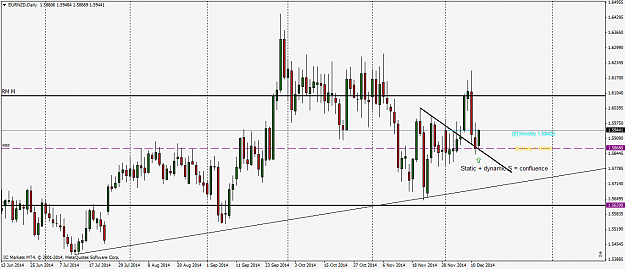
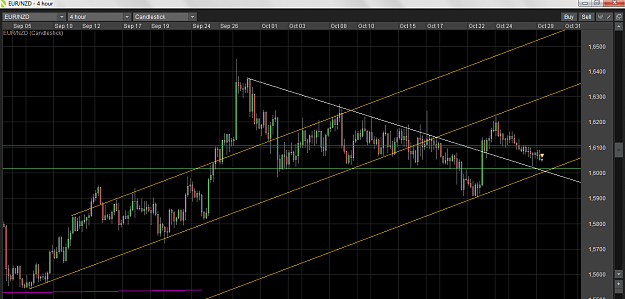
EURNZD I see a potential for about 1000 pips to the upside if the right conditions are met P is supported by both static and dynamic S. Bulls have shown strenght as they managed to engulf previous swing high and close above M RM. P has been since ...
Beyond the Candles
- ponchofx replied Dec 12, 2014
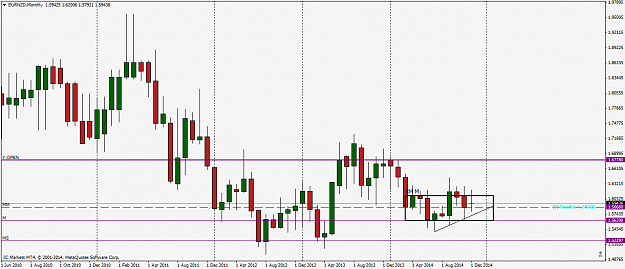
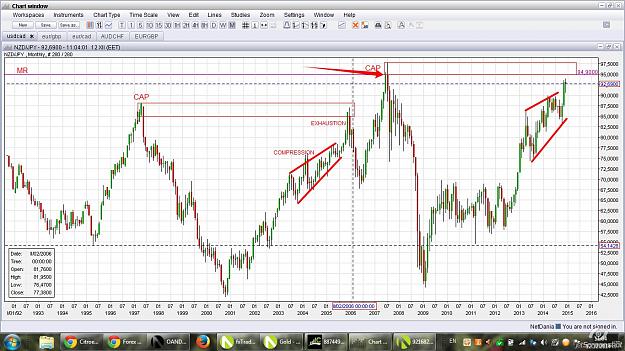
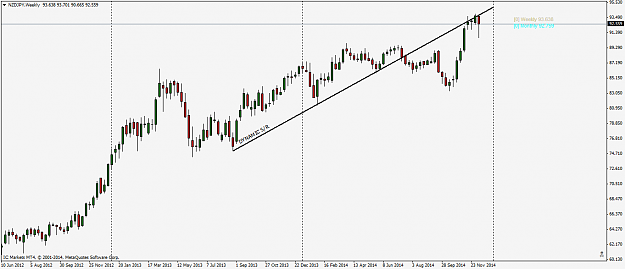
NZDJPY I would be cautious with longs at these levels. I am actually looking to short this pair. 1. From technical perspective - Look left on the M chart, we are near major MR. image W chart shows dynamic S broken in the past and is tested at the ...
Beyond the Candles
- ponchofx replied Oct 29, 2014
FXAction, I took a similar trade. Price broke local support and retraced a little so I got in. I have to watch it though cause I expect some reaction at the TL. Anyway, I'll be looking for the P to fill at least the pin bar's wick or just grab 20 ...
my system of 20 pips
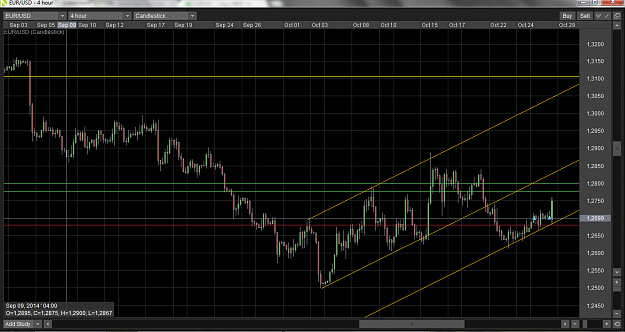
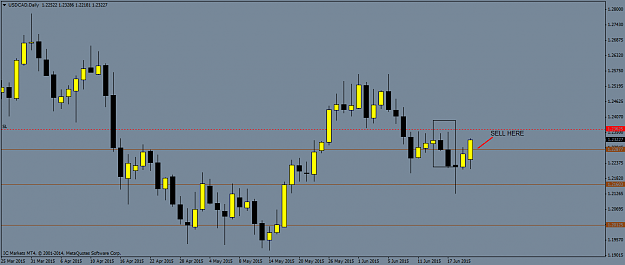
- ponchofx replied Oct 23, 2014
My 20 pips for today. Normally I wouldn't take it yet at that level but My decision was supported by the fact that P turned at the M opening P(the purple liine). If bullish momentum persist a good trade should be 1.2680 - 1.27 level image
my system of 20 pips
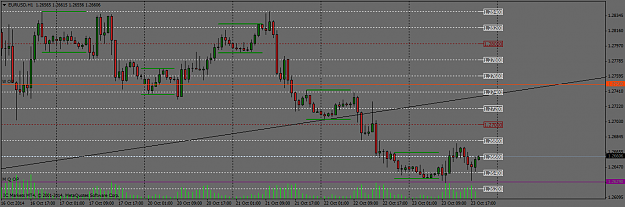
- ponchofx replied Oct 23, 2014
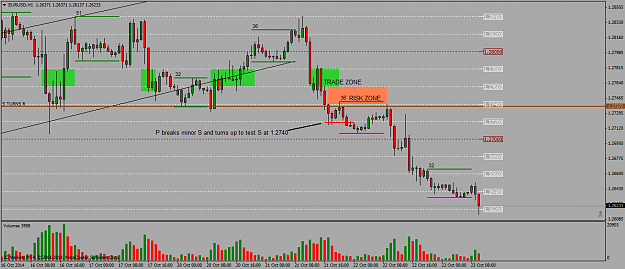
Did anyone figure out how to always end in profit when SL is hit? I'vetook the time to reconstruct the chart from post 27 the way I see it cause it's very unclear at some spots. This is what I got and I would ask CAT to verify if I got everything ...
my system of 20 pips
- ponchofx replied Oct 23, 2014
Hi FXyao, CAT did take trades similar to yours although this one is a little risky because right above you have bigger S broken at 1.2740. Price recovers the last broken S on increasing V so if you bought at 1.2720 you should have been OK to 1.2740. ...
my system of 20 pips