- Search Energy EXCH
- 106 Results
-
 polatok replied Nov 24, 2022
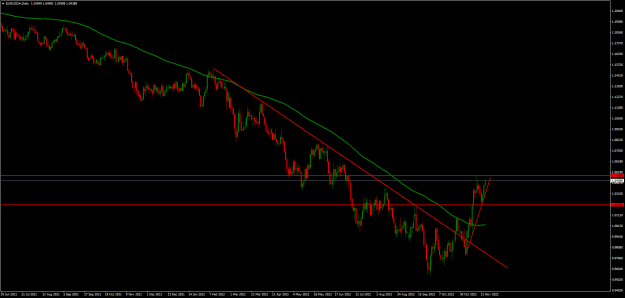
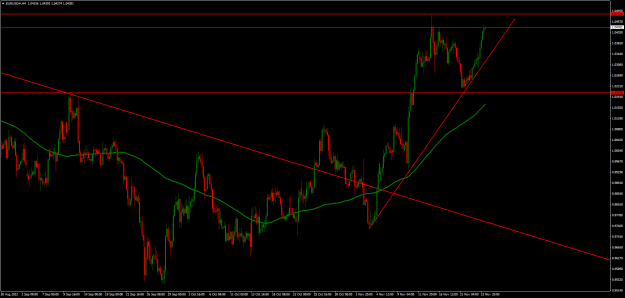
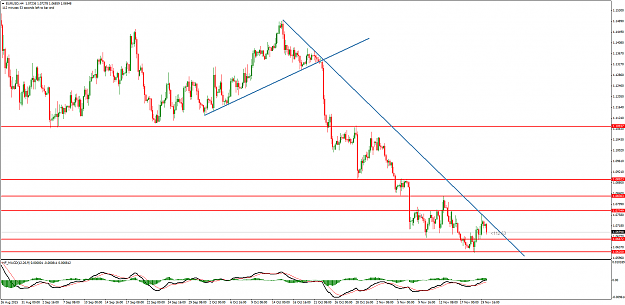
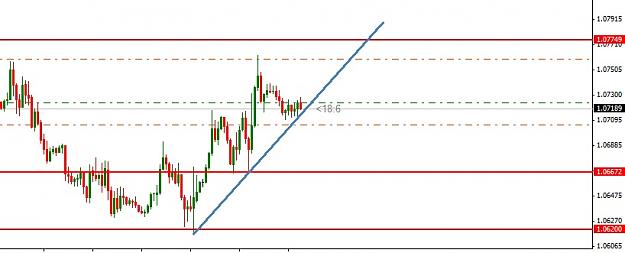
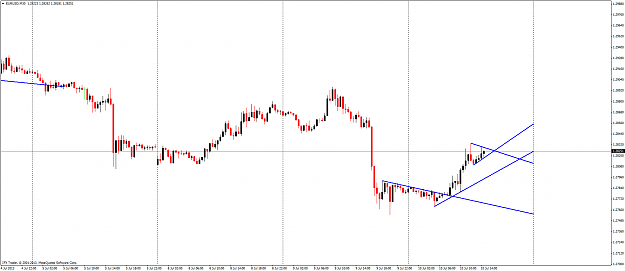
Daily and 4h chart. i think If previous high break and price goes up then price will be bullish for few days.
EURUSD only
- polatok replied Nov 24, 2015
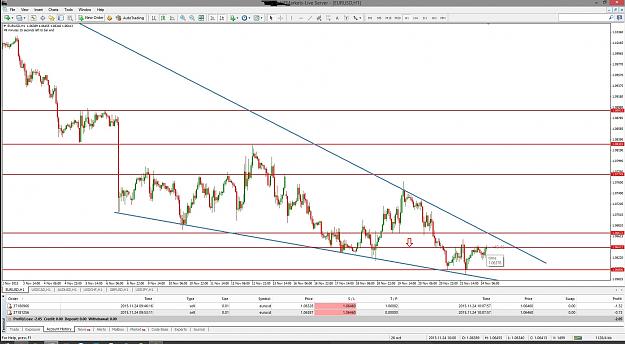
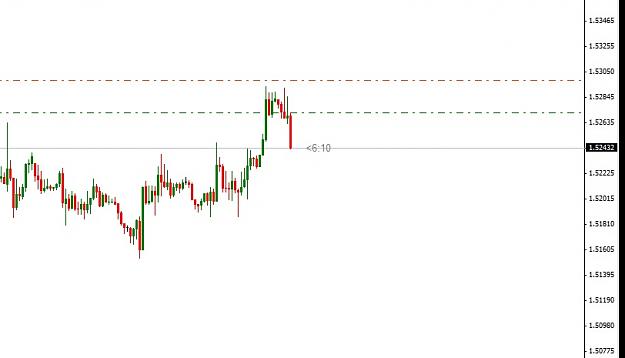
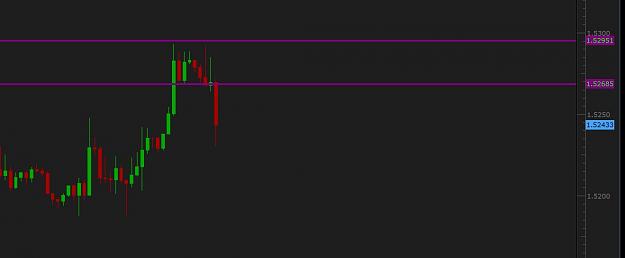
Is this ok ? my sl was at 1.06460 and price was max at 1.06455 by broker close my trade before price reach my sl.
The Club!
- polatok replied Nov 20, 2015
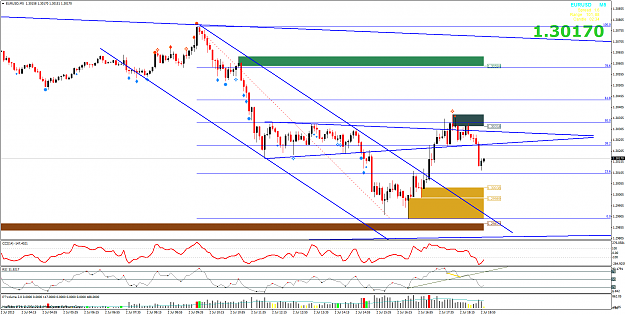
i am not going to buy eur/usd until it's break TL and 1.0775. Still 2 short active.
The Club!

- polatok replied Nov 19, 2015
same problem again. now there is no spike in my broker but fxcm has.
The Club!
- polatok replied Nov 18, 2015
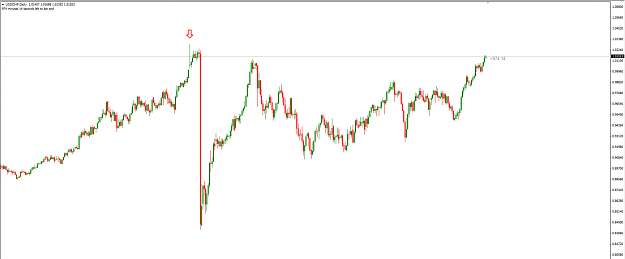
I am using hotforex broker real account and today i saw this spike in daily TF. i checked few other brokers chart but don't find this spike anywhere. This is USDCHF in Daily TF. Do you have this spike ?
The Club!
- polatok replied Jul 10, 2013
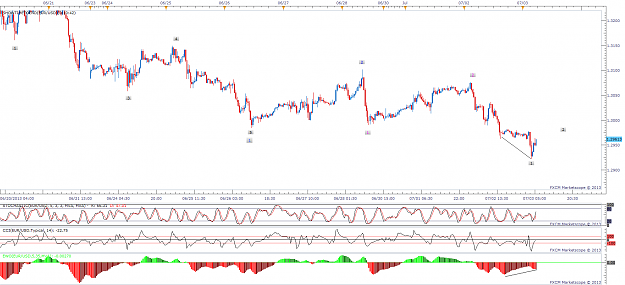
eur/usd is nicely coming to position of tl........ looks like it will do something soon.........based on momentum i think it will go down. image
The Club!
- polatok replied Jul 9, 2013
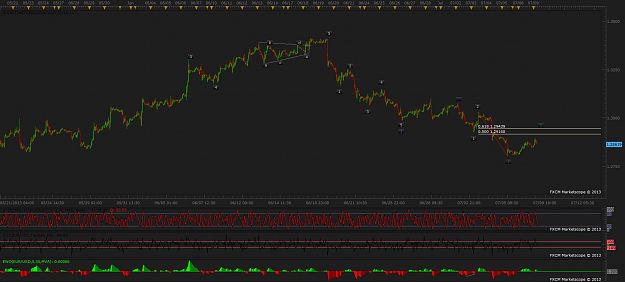
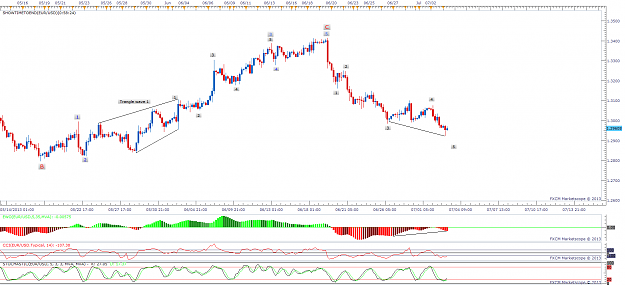
Based on the 30m big price data chart we are nicely going down. Elliott wave count show that we already complete blue wave 1,2 and now we are in blue wave 3. image In 30m chart with few price data we can see that we are in green wave 2. already ...
Spider's Den


- polatok replied Jul 9, 2013
Based on the 30m big price data chart we are nicely going down. Elliott wave count show that we already complete blue wave 1,2 and now we are in blue wave 3. image In 30m chart with few price data we can see that we are in green wave 2. already ...
The Club!
- polatok replied Jul 9, 2013
Based on the 30m big price data chart we are nicely going down. Elliott wave count show that we already complete blue wave 1,2 and now we are in blue wave 3. image In 30m chart with few price data we can see that we are in green wave 2. already ...
EURUSD


- polatok replied Jul 3, 2013
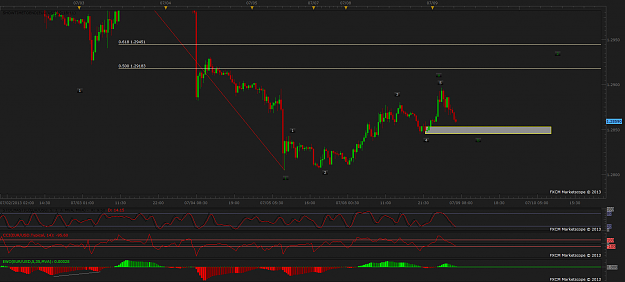
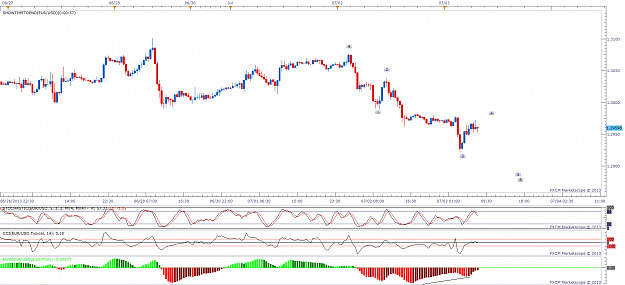
so far i can come up with this count, 4h and 30m chart. in 4h chart ewo show divergence also cci and stoch show upward momentum. image divergence also visible at 30m chart but i think one more push down needed before go up. image
The Club!
- polatok replied Jul 3, 2013
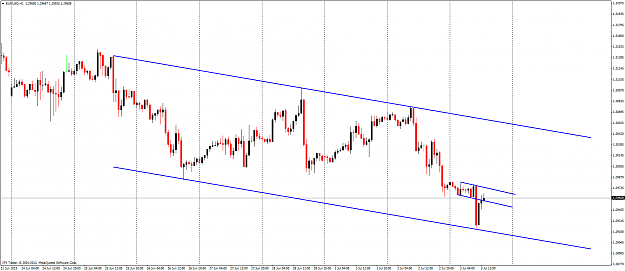
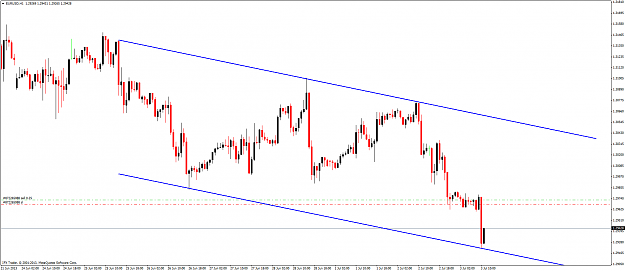
price nicely bounce form 1h trend channel and come back between intraday trend channel. if this 1h candle close between this channel then anything is possible. i am waiting for channel break and open a tread. image
The Club!
- polatok replied Jul 3, 2013
todays ew count.... lot's of 1,2 1,2 may be this is the way to go down for long time or this is a complex blue wave 2. image
The Club!

- polatok replied Jul 3, 2013
yesterdays ew count work well for us. and now we are going more deep. current count is 1,2 1,2 1,2 1 and now i think we will go up to complete wave 2 black then big down possible. also check divergence in ewo indicator. image
EURUSD

- polatok replied Jul 3, 2013
This 1h channel holding eurusd for further down.......... image
The Club!
- polatok replied Jul 3, 2013
i wake up 2 hour before i normally do...... and find out that...... rising early in the morning good for trading too... image
The Club!
- polatok replied Jul 2, 2013
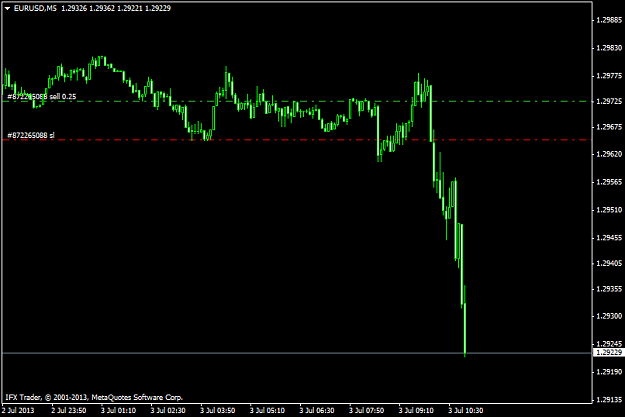
price nicely bounce form 50% fibo. if my ew count is right then this is the last bounce before break long time support 1.2984 image
The Club!