- Search Energy EXCH
- 17 Results (1 Thread , 16 Replies )
-
 plus50 replied Sep 30, 2014
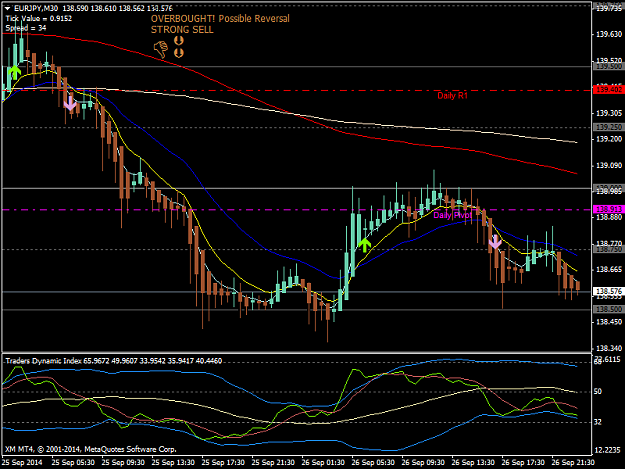
As the $index turns...... still waiting but getting itchy
Cable Update (GBPUSD)
- plus50 replied Sep 28, 2014
Hey Dennis, Just saw your spread, ouch! That's a rip. Around three times what it should be (see attached), unless the screenshot was around a major news event in which case spreads do go crazy.
my system of 20 pips
- plus50 replied Sep 13, 2014
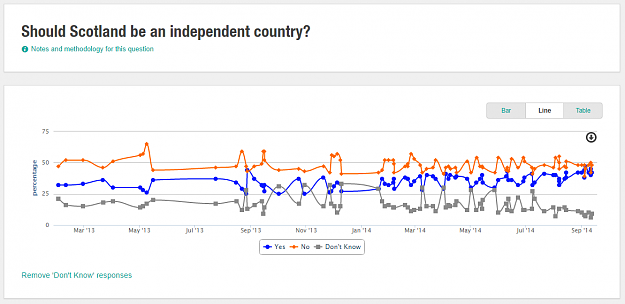
Referendum polls The only decipherable trends seem to be : 1. Yes and No getting so close that it is now within statistical error and impossible to call. Error 5% - 7% for sample size under 500, or 3% to 4% is sample size over 750 (Source : url ) ...
Cable Update (GBPUSD)
- plus50 replied Aug 1, 2011
EURUSD Daily BEOB — Debt ceiling deal is in place therefore focus on Europes woes should again take over the limelight, hence the beautiful BEOB forming on the EURUSD Daily chart. Looking for a retracement to 1.42500 approx 23.6 fib for a ...
james16 Chart Thread
- plus50 replied Jun 9, 2011
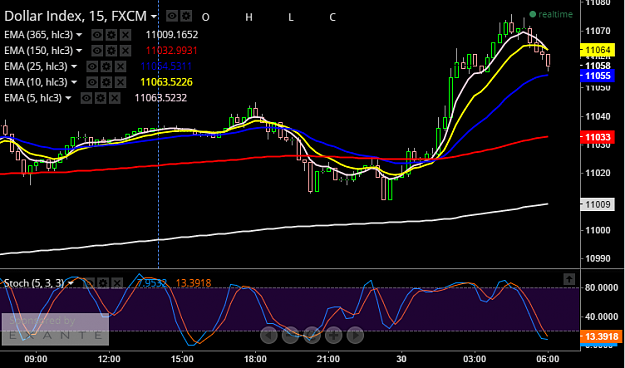
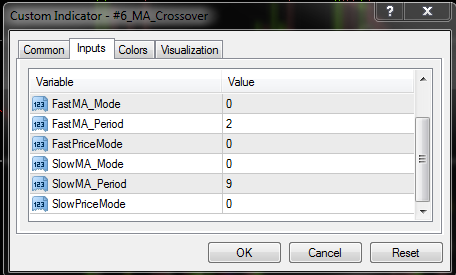
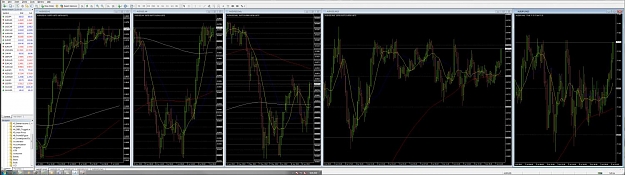
Alert Setup — I played around with the settings (still dont know what they mean, but playing never hurts). On the attached chart the 5 and 10 Moving Averages are the crosses I like to trade, the Blue is MA25, Red MA150 and While MA365 which ...
Setting Up Moving Average Crossover Alert?
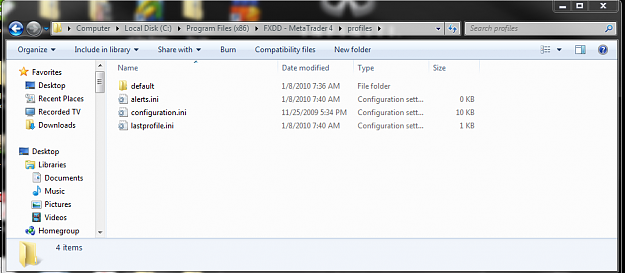
- MT4 - cant save profilesStarted Jul 10, 2010|Platform Tech|5 replies

I want to copy my customized profiles to a different computer. But the profiles folder is empty ...
- plus50 replied Feb 3, 2010
is the A+++ — Need fresh eyes to look this over, how would you trade this pin bar currently forming on the EU daily. *It is at 23.6% of the move from 1.4580 *Also at 50% of the move from 1.4205 *It touched the 10EMA line.
james16 Chart Thread
- plus50 replied Jun 25, 2009
GJ nice bounce of fib — Indeed the book doesn't lie! Almost 100pips up from bounce of 23% fib level. Its times like these I wish I wasn't trading demo. But the humbling times, and they still do happen remind me that I should stick to demo'ing ...
james16 Chart Thread
- plus50 replied Jun 17, 2009
Weekly Eye Candy — Udita Goswami
Trading using Murray Maths and Price Action

- plus50 replied Jun 10, 2009
EUR/CAD — I was looking at this pair also, 4hr looks bearish, Daily looks good for long. Could that pin bar, be a pinocchio? Need more experienced chart reading eyes to comment pls.
james16 Chart Thread

- plus50 replied Jun 7, 2009
developing trade setup — Attached is the E/U daily chart, from about 5 mintues ago. I am interpreting this as bearish. Assuming I am right on the reading the last full pin bar as bearish, when would you jump into a short trade : 1. Is it ...
james16 Chart Thread
- plus50 replied Jun 6, 2009
Weekly Eye Candy — Something has to brighten each thread page, last week Amrita Rao did a great job, this week its Isha Koppikar.
Trading using Murray Maths and Price Action

- plus50 replied Jun 4, 2009
Seems plausible — I am new to this also, what you proposed as an explanation certainly seems like a possible scenario. Suffice to say there is a lot to learn about interpreting volume and price action. For now I am only entering trades when ...
Trading using Murray Maths and Price Action
- plus50 replied Jun 3, 2009
Yuppie * ns_kathik — Thank you both for the feedback, in the quest for knowledge I find this kind of community co-operation invaluable. Attaching picture of a Bollywood beauty for the thread to enjoy, since Sneha has been missing for a while. ...
Trading using Murray Maths and Price Action

- plus50 replied Jun 3, 2009
what does this high volume bar tell you? — Another question for you Karthik, See the high volume bar and the accompanying candle, the one with the rectangle around it. The candle, shows a price increase yet the closing price is much less than ...
Trading using Murray Maths and Price Action
- plus50 replied Jun 1, 2009
5 min EUR/USD — Karthik, Please look at the attached 5min EUR/USD, the strong volume indicator (Red bar) I took to mean resumption of the bullish move. It went to 1.4220 range and then dropped down to 1.4150 range. Were there any sign that I ...
Trading using Murray Maths and Price Action
- plus50 replied Apr 7, 2009
Let me start by saying I am a novice at using the Karthik Method, but trying to explain my umderstanding to help me further understand, if I am right or get corrected if I am wrong. For a quick example, look at USHCHF 1Hr, it hit 1.1475, this was ...
Trading using Murray Maths and Price Action
- Posts by Member Search: 'plus50'