- Search Energy EXCH
- 61 Results (1 Thread , 60 Replies )
- pipmac replied Oct 26, 2012
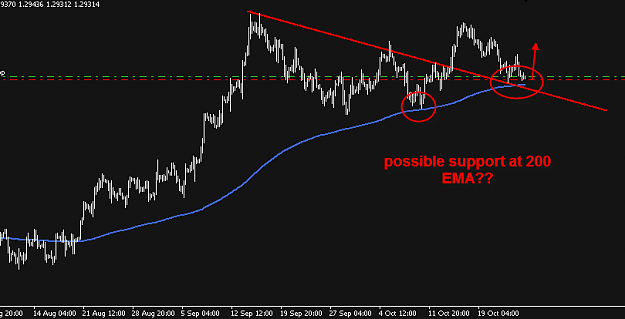
4 hour 200 EMA support seems to be breaking down but you never know. The 200 ema deserves some attention. A 4 hour stall above the 200 ema would swing probability to the upside.
EURUSD
- pipmac replied Oct 11, 2012
usd/chf and 200 MA — usd/chf falls below the 200 ma several times and pops back above it. BUT this time it's finding resistance under the 200 ma. Maybe its worth considering
EURUSD
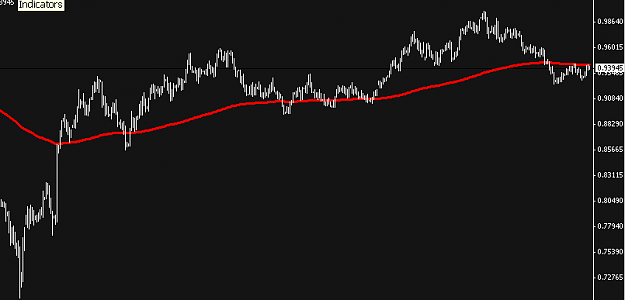
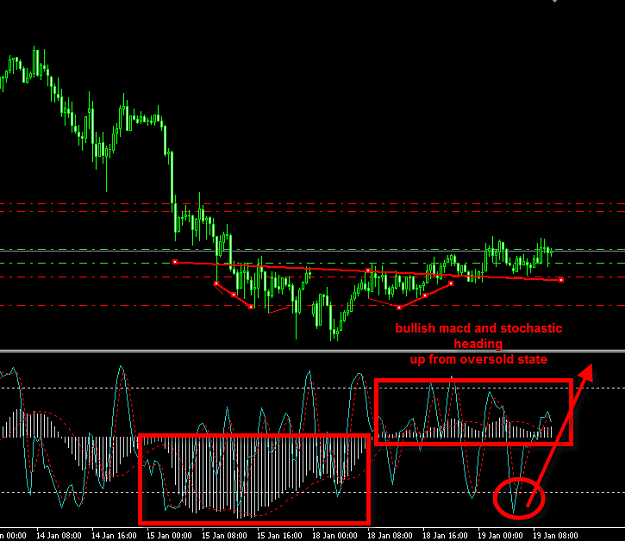
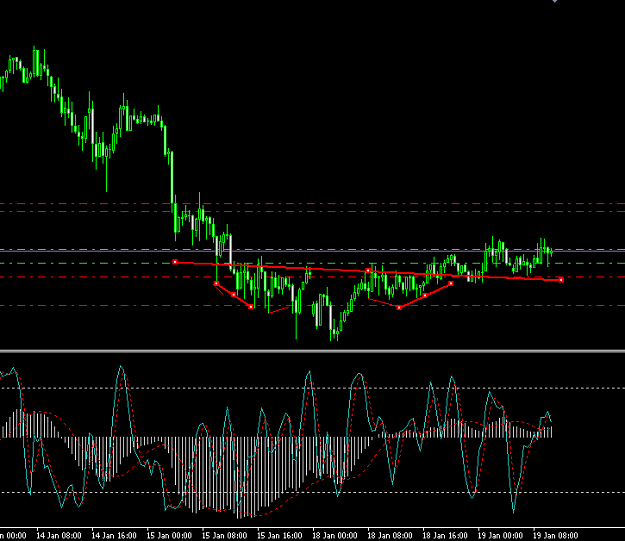
- pipmac replied Jan 19, 2010
i like charts this just my opinion it could go either way i'm well aware of that but for the sake of discussion.....
EURUSD
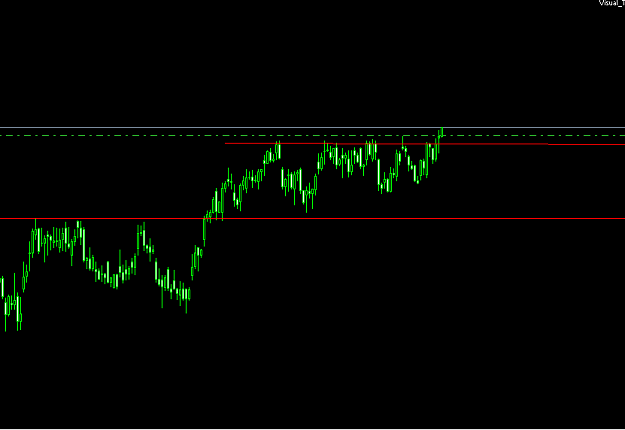
- pipmac replied Oct 27, 2009
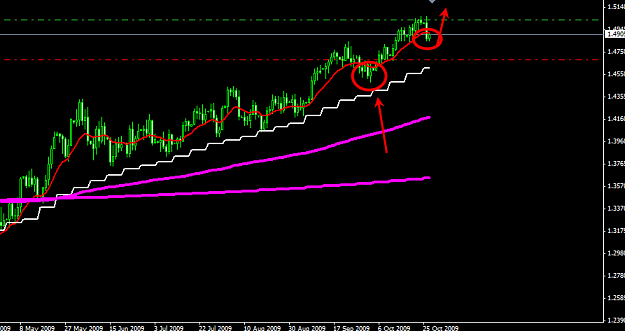
euro daily chart — mmmm looks suspicious....charts are beautiful...
EURUSD
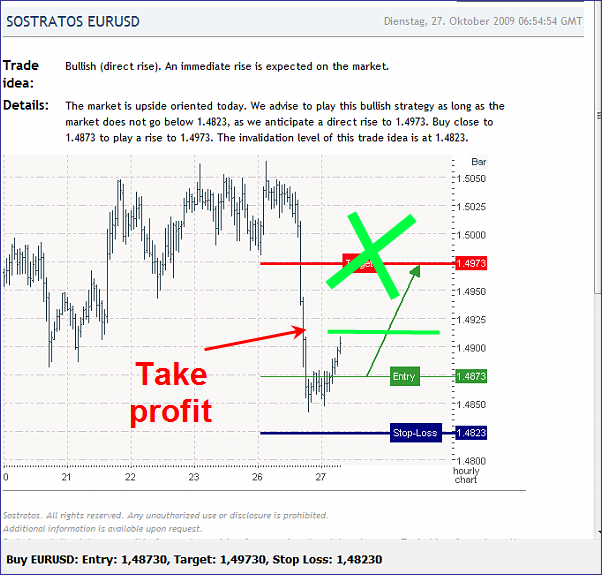
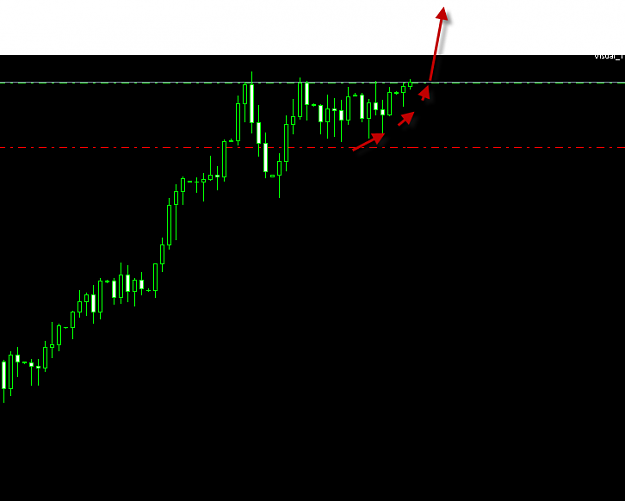
- pipmac replied Oct 27, 2009
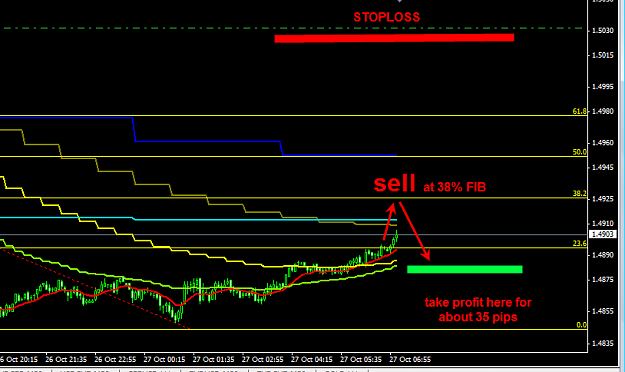
Trade that is "to good to fail" — "To good to FAIL" jpmorgan
EURUSD
- pipmac replied Oct 27, 2009
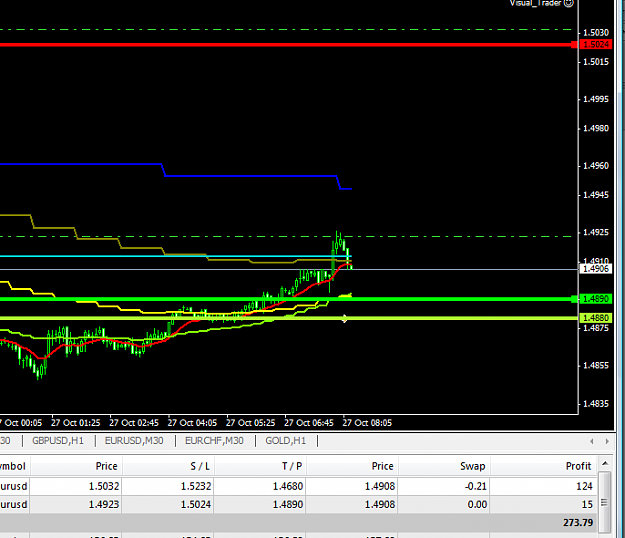
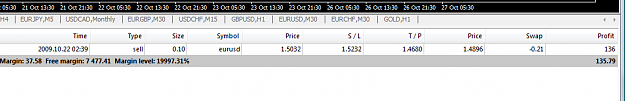
It's odd but many of the trades you call i'm already in or i take them shortly before you call them or i'm watching for a possible trade. I took the euro short on 10/22 for a 300+ TP. It's just wierd but we see similiar setups at the same time. I ...
EURUSD
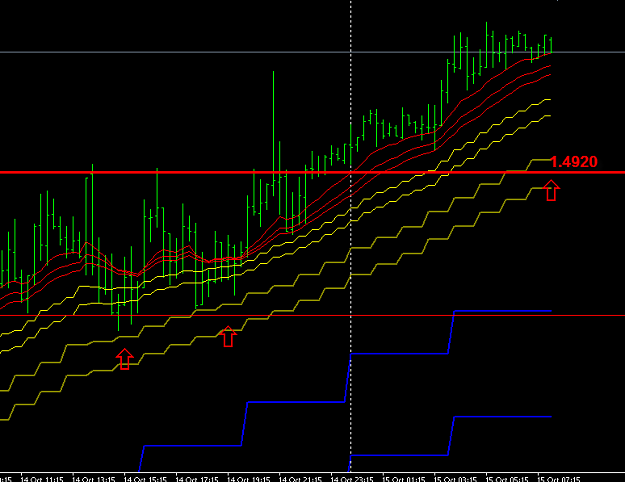
- pipmac replied Oct 15, 2009
A 15M candle stall in this area will prob be good for 20-30 points.
EURUSD
- pipmac replied Jun 29, 2009
Stocks have moved upward with Pound and Euro in the last year or so. Here is a stock chart of JNJ (johnson and Johnson)
EURUSD
- pipmac replied Jun 29, 2009
This market could break out tonight to the upside. This is what i see on Gbp/usd. Daily chart. If it breaks through that ceiling then its going to fly.
EURUSD
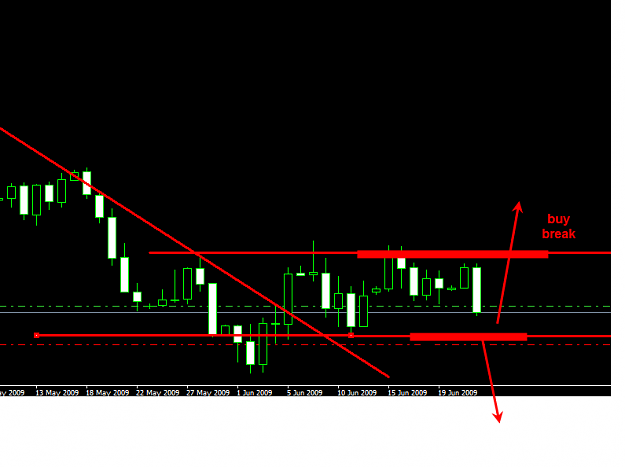
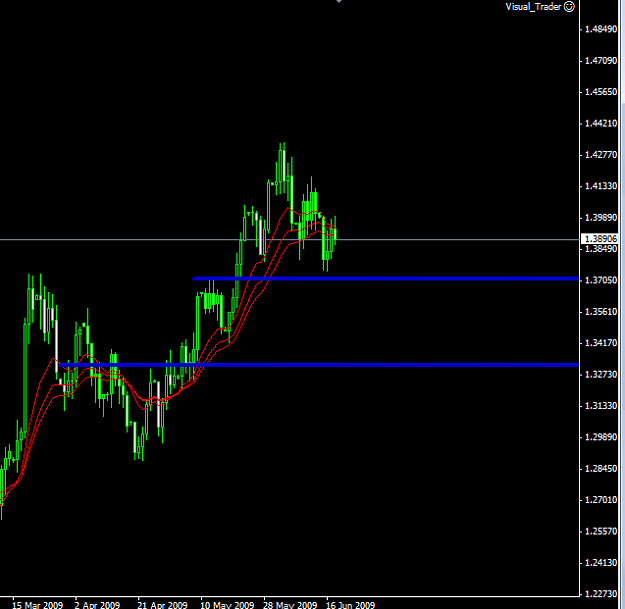
- pipmac replied Jun 18, 2009
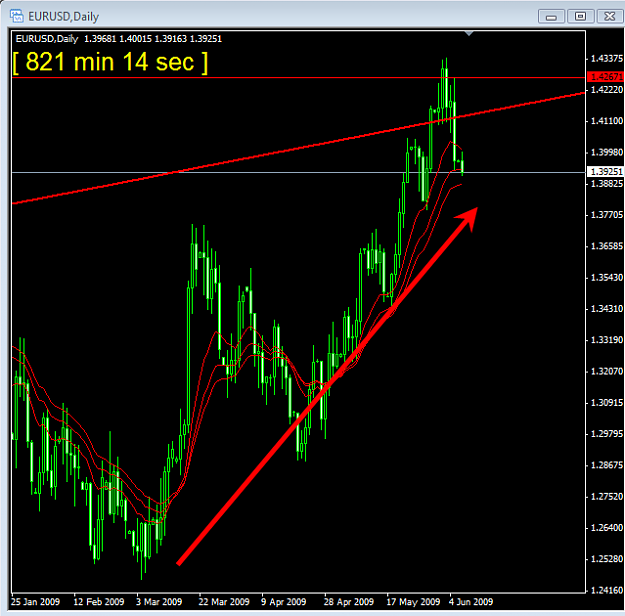
Euro upcoming support levels (Daily) for possible long positions IMO.
EURUSD
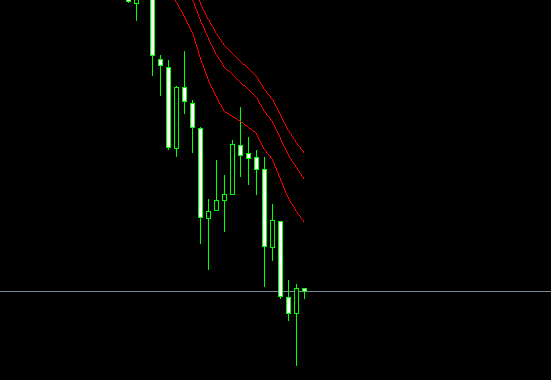
- pipmac replied Jun 10, 2009
Gotta like that if your looking to buy here. 15M TF...couldn't be a bad thing....
EURUSD
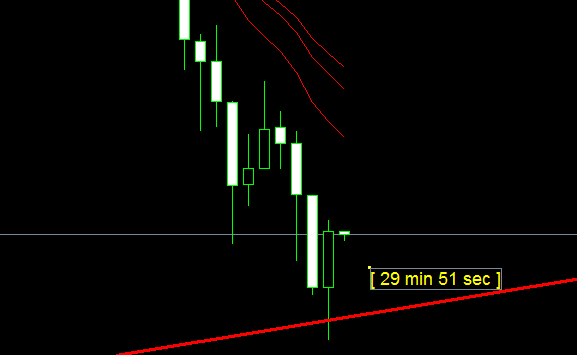
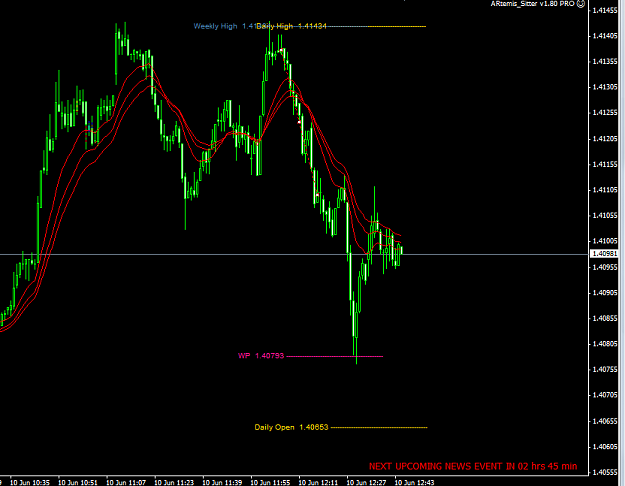
- pipmac replied Jun 10, 2009
wow, nice bounce on the weekly pivot (WP) drawn on the 1m chart. maybe pivots work...well everything works....sometimes.
EURUSD
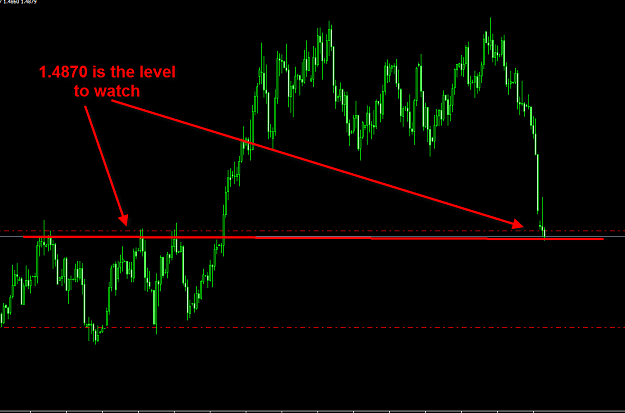
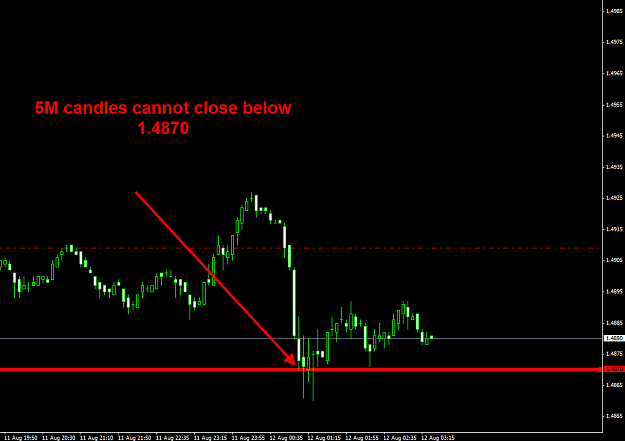
- pipmac replied Aug 11, 2008
No close below 1.4870 since 2007. IF YOU DISCOUNT THE WICKS then a close below 1.4870 officially breaks the weekly support.
EURUSD