- Search Energy EXCH
- 16 Results
-
 payal replied Sep 18, 2012
Inverted H&S on H4?? — I know were are in a serious downtrend, but I see a kind of inverted H&S on H4 (LOL).. IMO, we may see a retest of 1.0520 or so and fail ;( Is this possible???
Aussie Trading Room and Cartoons Gallery
- payal replied Sep 6, 2012
I see a H&S on Daily — I am seeing a H&S on Daily, IMO, 430-440 maybe the completion of the other shoulder.
Aussie Trading Room and Cartoons Gallery
- payal replied Aug 16, 2012
Did you get run over by the bulls?
Aussie Trading Room and Cartoons Gallery


- payal replied Aug 13, 2012
I saw last Friday an H&S on H1. Now I clearly see a Big Bear's H & S
Aussie Trading Room and Cartoons Gallery I hope I am reading it with my glasses on correctly. We should see the support at 495 give way to more downside IMHO
- payal replied Aug 10, 2012
H&S on H1?? — Kind of a H & S....
Aussie Trading Room and Cartoons Gallery
- payal replied Aug 9, 2012
IFR — China bears roar after y'days data dump - IFR Ambrose Evans-Pritchard UK Telegraph - China heading for a hard landing AEP makes well known China bears - Jim Chanos/Hugh Hendry look tame AEP picks the worst of the worst commentary ...
Aussie Trading Room and Cartoons Gallery

- payal replied Aug 3, 2012
H&S on H1?? — Possible H&S on H1?
Aussie Trading Room and Cartoons Gallery
- payal replied Aug 1, 2012
AUDUSD failed around its 38.2% retracement level, now there is significant downward pressure, I guess.
Aussie Trading Room and Cartoons Gallery

- payal replied Aug 1, 2012
This is what happened, I guess
Aussie Trading Room and Cartoons Gallery ....
....

- payal replied Jul 31, 2012
DT, did you get caught up in this..
Aussie Trading Room and Cartoons Gallery
- payal replied Jul 31, 2012
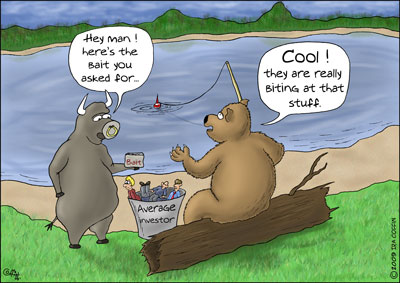
Is it time yet for the bears or is it just a bait
Aussie Trading Room and Cartoons Gallery
- payal replied Jul 31, 2012
8hr chart — According to this chart, if I read it correct, we might see the bottom of the channel at 1.0250 level in the next few days or so. Correct me if I am wrong.
Aussie Trading Room and Cartoons Gallery
- payal replied Jul 26, 2012
Possible triangel in play?? — Papa, As per this we should hit the 1.0250 level, your FIB 50 projections, before moving further up, right? Series of 3 wave moves highlights triangle possibility Last 3 wave "E" leg looks like it is still to come ...
Aussie Trading Room and Cartoons Gallery

- payal replied Jul 20, 2012
The former level 1.0233 may hold the downside/correction as it is the cloud top on the weekly chart and the bottom of the trendline drawn from May 27 low.
Aussie Trading Room and Cartoons Gallery
- Posts by Member Search: 'payal'