- Search Energy EXCH
- 110 Results
- parviz1953 replied Dec 5, 2018
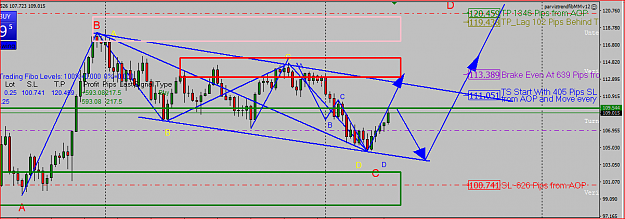
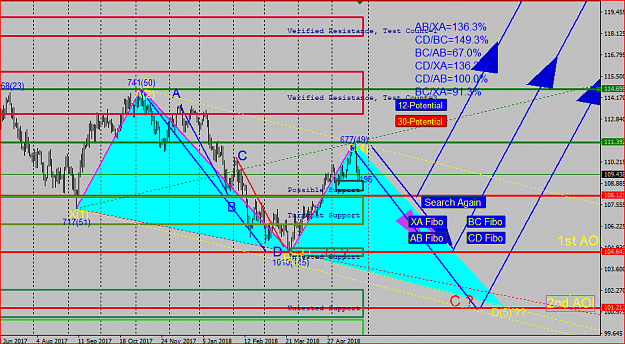
Hi: CADJPY H4 Price @ D point of a Cypher And C point of a Gartely Pattern and of course C point of an ABCD....., Expectation : Long..?? I am not a fan of the patterns ,except, ABCD and 3 Drives...,but let's see... image
Ratios & Harmonics: a Different Way to Trade
- parviz1953 replied Sep 9, 2018
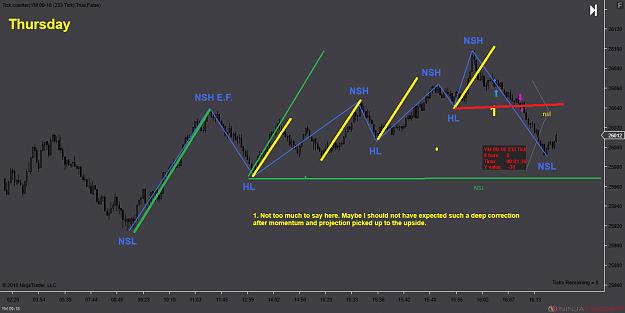
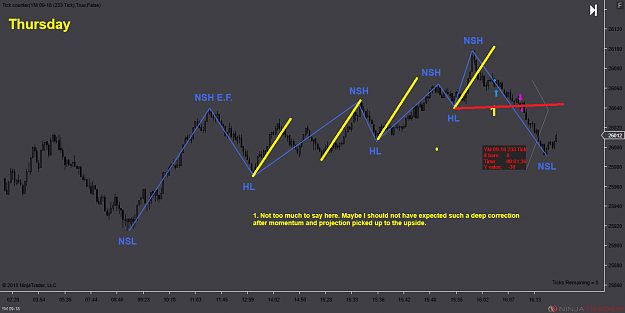
OH no I don't mean that, all of them are NSH ,but i choose the one which best fit my selected swing, and in this case it is the last one. My point is not about the definition of NSH , but that you are not going to call the next move NSL unless you ...
Ratios & Harmonics: a Different Way to Trade
- parviz1953 replied Sep 9, 2018
Hi: It is not that mine is good and his is not. The whole idea is what order flow you are trading , when you draw your main swing , then all of your subsequent decision depends on it. For example: 1) you look for the price to find on what fib % of ...
Ratios & Harmonics: a Different Way to Trade
- parviz1953 replied Sep 8, 2018
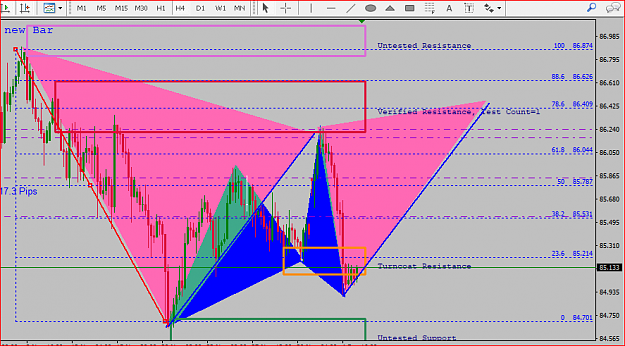
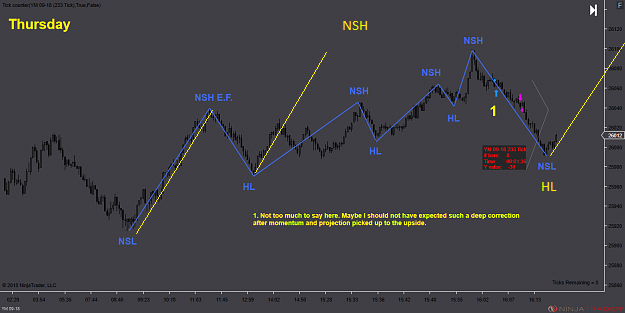
Hi : i believe that you are mixing up different order flow and that may be reason of your wrong expectation , i have chosen your Thursday chart to explain my point. image You have correctly identified your main swing, but then you have chosen NSH ...
Ratios & Harmonics: a Different Way to Trade
- parviz1953 replied May 27, 2018
Thanks : but do you mean this blue CD swing ? which is broken by forming NSH ? Even when i consider that one what i see is a very small projection and expecting a deep correction, wouldn't it be so...? image A very interesting phenomena that i just ...
Ratios & Harmonics: a Different Way to Trade
- parviz1953 replied May 26, 2018
Update on USDJPY weekly: image Daily chart of same area: image EDITED :Coreg 2004 :if you agree we may here try to trade short on the basis of the daily main swing down, an abcd corrected to its golden zone and now at its c point, (Yellow CD leg ...
Ratios & Harmonics: a Different Way to Trade
- parviz1953 replied May 20, 2018
Hi : I have spent a lot of time studying the harmonic pattern and applying them on my trades, in MHOP and according to my experience, their failure rate is more than their success, and i believe the reason that some of them works better is because ...
Ratios & Harmonics: a Different Way to Trade
- parviz1953 replied May 13, 2018
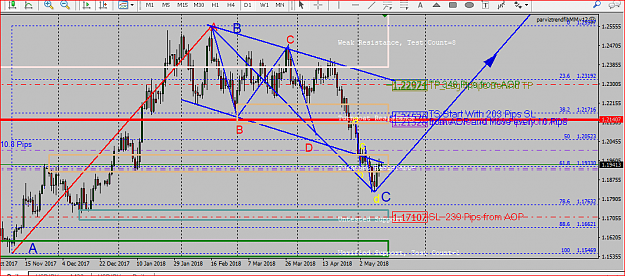
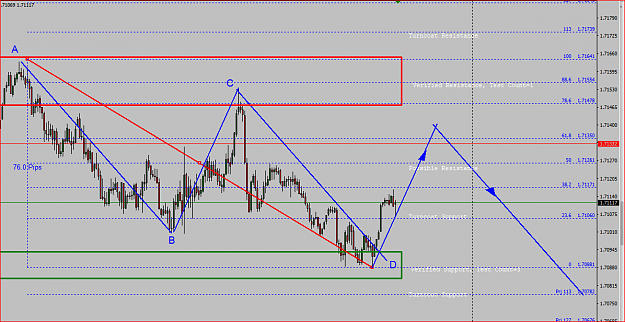
This is my expectation for EURUSD on Daily TF: Look at the big Blue ABCD at its "C" point and its confluence with the much smaller order flow of small yellow abcd at its completion "d" point....??!! image
Ratios & Harmonics: a Different Way to Trade
- parviz1953 replied May 13, 2018
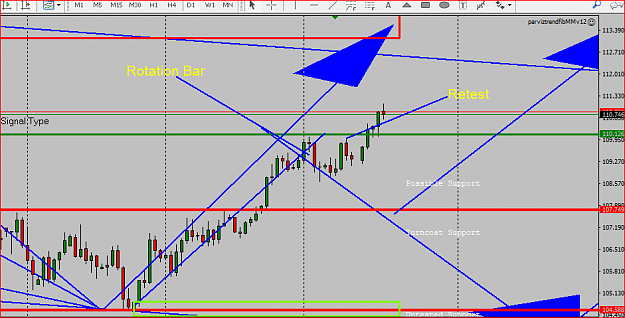
To clarify my point this is the daily chart of the same pair, i have entered short at the completion of the rotation candle on this TF, as you can see during the last weeks it took 5 days for the price to go up again for retest of the resistance, ...
Ratios & Harmonics: a Different Way to Trade
- parviz1953 replied May 13, 2018
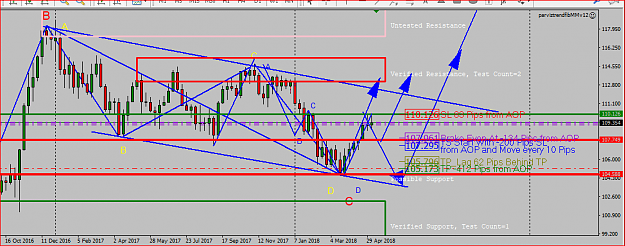
Update on USDJPY Weekly: Expectation is still bearish correction , last week i was 30 pips in profit and i am beginning this week, 30 pips down. image
Ratios & Harmonics: a Different Way to Trade
- parviz1953 replied May 10, 2018
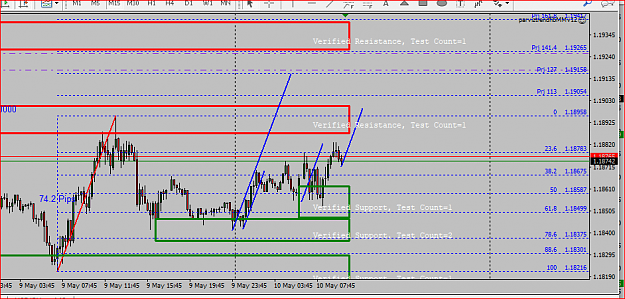
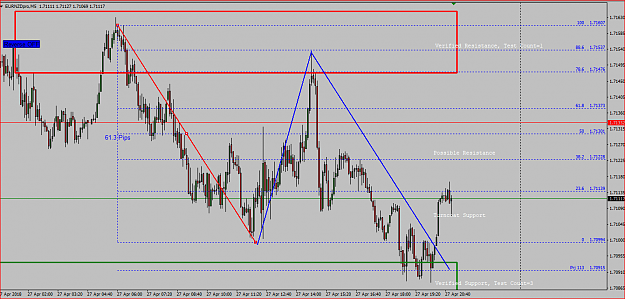
EURUSD M15: M5 and M15 expectations superimposed: image
Ratios & Harmonics: a Different Way to Trade
- parviz1953 replied May 6, 2018
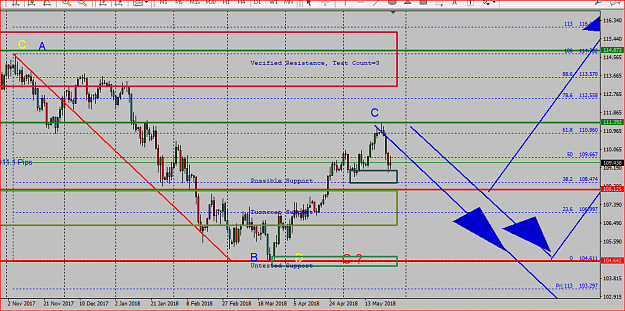
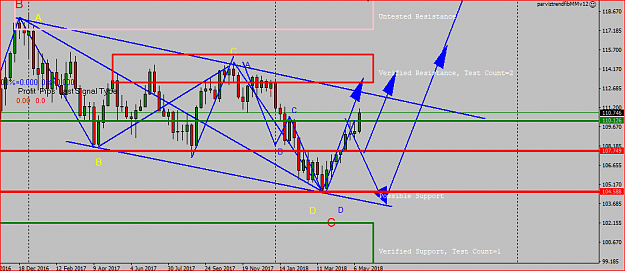
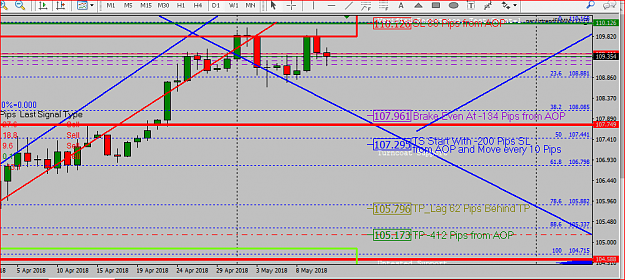
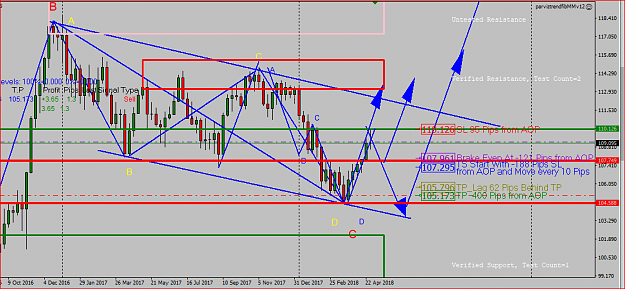
Update on USDJPY weekly: I have exited the long position with around 300 pip and after a rotation candle on daily TF i entered short and this is my new expectation and settings now: image And this is the D1 timeframe of the same chart and its ...
Ratios & Harmonics: a Different Way to Trade
- parviz1953 replied Apr 30, 2018
Update on Potential Bat pattern of EURUSD M30. price on the BC leg , has used up to its last pips of a valid correction (88.6% of its AB length) before i call it a failure , and is now in a complex correction, i still hope that it will return to its ...
Ratios & Harmonics: a Different Way to Trade
- parviz1953 replied Apr 30, 2018
EURUSD Tick chart 1597 T , a little while later showing rotation candles too: image I already entered Long and you can see my SL and Tp settings .
Ratios & Harmonics: a Different Way to Trade
- parviz1953 replied Apr 30, 2018
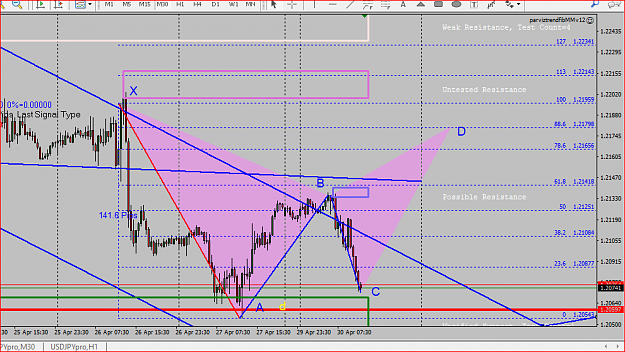
EURUSD M30: A potential bearish Bat pattern at its "C" point......?? image (Saddled horse ready to ride Long way North..??
Ratios & Harmonics: a Different Way to Trade

 )
)
- parviz1953 replied Apr 29, 2018
I would like to add one more point to my answer: If you expect a symmetrical AB=CD pattern with 1:1 harmony, then the amount of fib projection of CD leg will depend on the percentage of the correction (BC leg), and a simple mathematical formula will ...
Ratios & Harmonics: a Different Way to Trade
- parviz1953 replied Apr 29, 2018
1) By instrument i meant the currency pair you are trading. 2) I believe, Your aqua blue ABCD has been invalidated when price has moved above its A point. 3) Structure is more important than fib, don't forget : "Structure is the king". 4) Look to ...
Ratios & Harmonics: a Different Way to Trade
- parviz1953 replied Apr 29, 2018
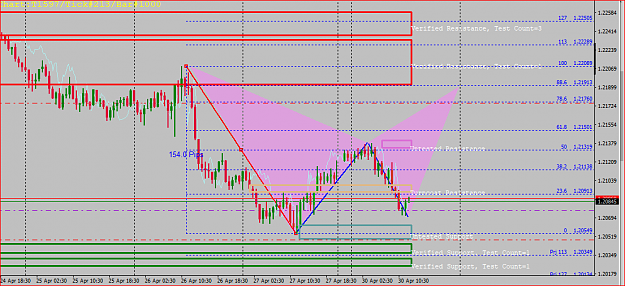
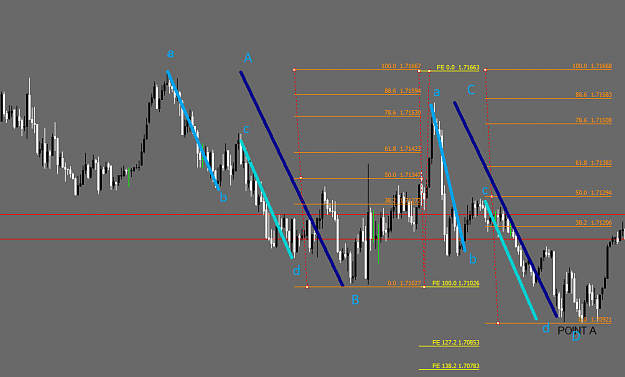
Hi: I redraw your trend lines over the order flows, indeed you have 2 abcd from a shorter term OF and one ABCD from the longer term OF. and you did have the confluence at your A point from a shorter and a longer term abcd both reaching their d point ...
Ratios & Harmonics: a Different Way to Trade
- parviz1953 replied Apr 29, 2018
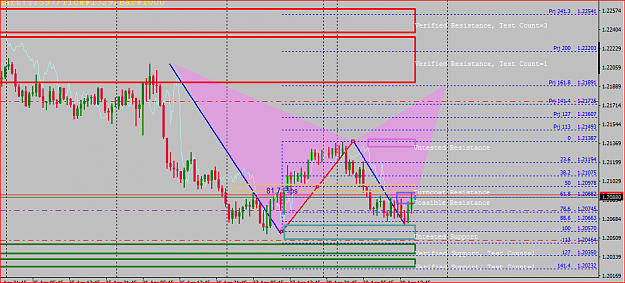
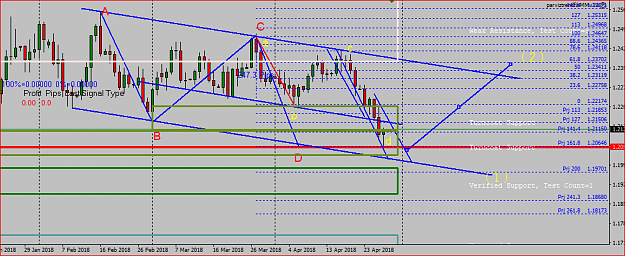
Hi : Update on EURUSD D1: In contrast to my expectation, price choose the 3rd path that i did not expect, and went through the formation of an extended CD leg of the "yellow abcd", exactly to the 1.618 of its "ab" leg fib extension, so i redraw the ...
Ratios & Harmonics: a Different Way to Trade
- parviz1953 replied Apr 29, 2018
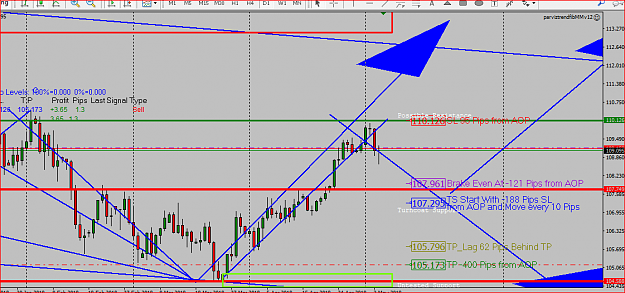
Hi: On follow up of my USDJPY expectation weekly: The long position i have taken previously on a demo account, is now 217 pips green, and i have drawn my expectations, lets see which path it will take , and what would be the main trend for the next ...
Ratios & Harmonics: a Different Way to Trade