- Search Energy EXCH
- 16 Results
-
 newdigital replied Dec 26, 2012
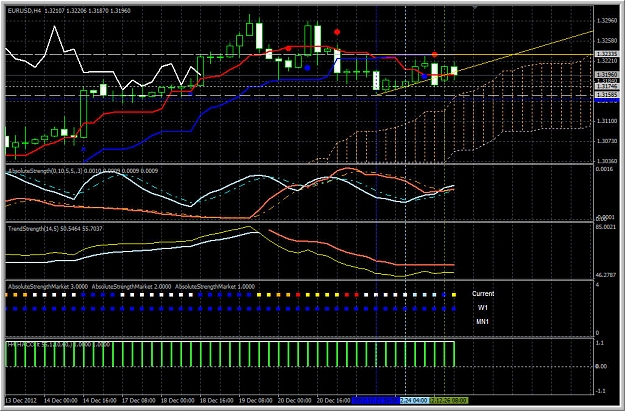
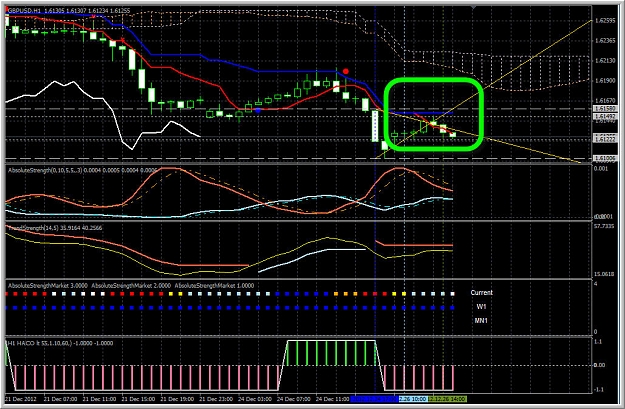
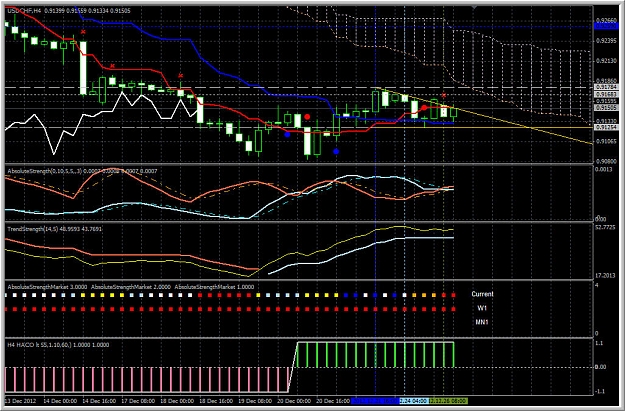
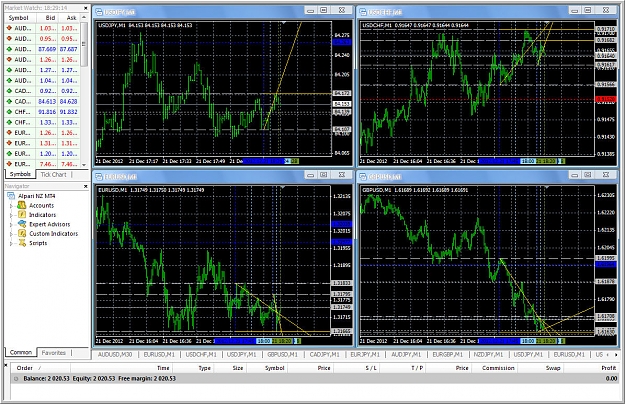
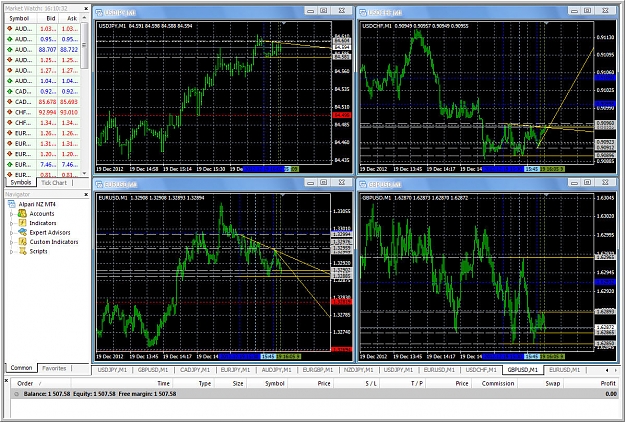
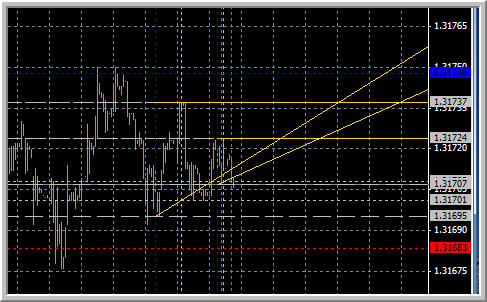
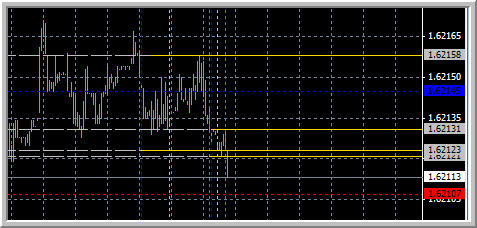
Because it is the end of December now - not very good time for trading. You can see the ranging market condition for EURUSD and USDCHF: image image The situation for GBPUSD is more good but it is non-trading area/time/zone anyway for now: ...
Trendline breakouts
- newdigital replied Dec 21, 2012
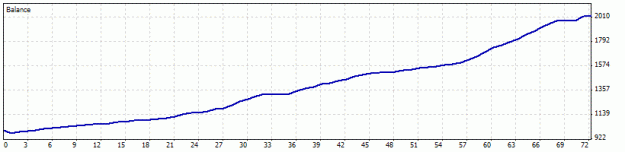
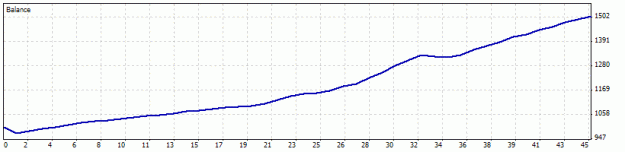
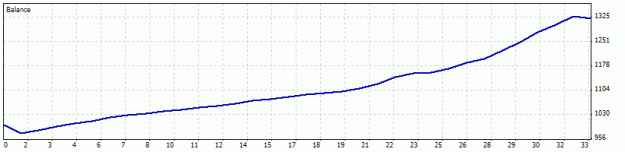
Updated trading results. Initial deposit is 1,000 Fix lot size 0.1 Start to trade in 13th of December this year. All the trades were closed. Closed P/L: 1 020.53 Total balance for now is 2,020.53 image image Metatrader statement is attached (in ...
Trendline breakouts
- newdigital replied Dec 19, 2012
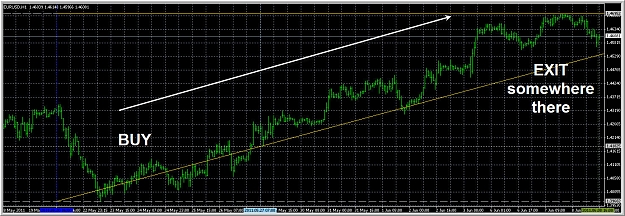
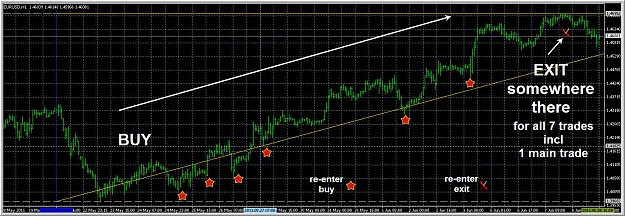
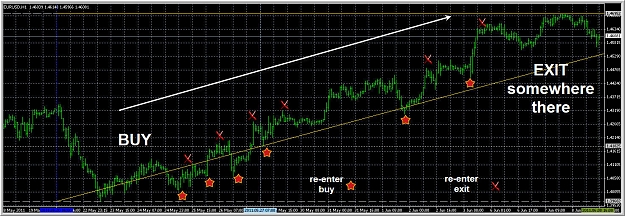
About re-enter ... It is something what I explained for some other forum. it is classical way of trend following trading (1 trade per chart/pair in trend following way): image It is classical way of trend following trading with re-enter: image ...
Trendline breakouts
- newdigital replied Dec 19, 2012
Updated trading results: image image ======= - MaksiGen indicator is on this post (indicator is drawing s/r/tl depends on preselected number of bars). - MTrendLine alert indicator is on this post. - MaksiGen_Range_Move mtf 2 indicator is on this ...
Trendline breakouts
- newdigital replied Dec 19, 2012
Thanks Igorad It is improved indicator (previous post) with template (attached): image
Arnaud Legoux Moving Average - ALMA
- newdigital replied Dec 18, 2012
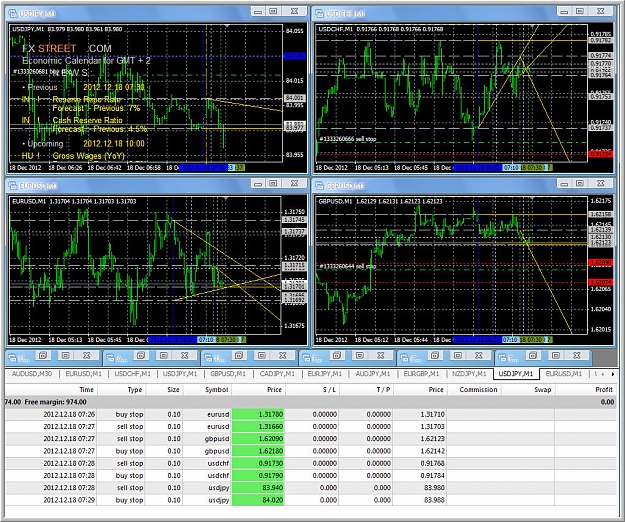
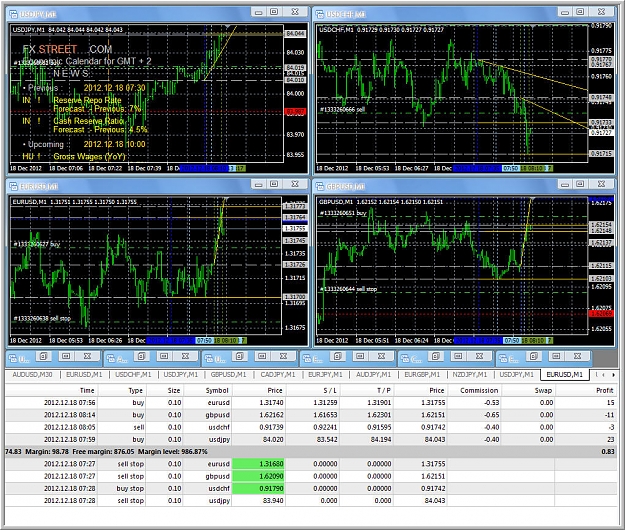
So, it is metatrader statement. I opened first trade for USDJPY yesterday (see some my previous post on this thread), and finished the trading few hours ago. image image Metatrader statement is attached to this post (in rar archive). Please find ...
Trendline breakouts
- newdigital replied Dec 18, 2012
The other "ready-to-go" case: image By the way, we are talking about breaks or breakout ... but correct terms are breakout and breakdown. ======= - MaksiGen indicator is on this post (indicator is drawing s/r/tl depends on preselected number of ...
Trendline breakouts
- newdigital replied Dec 18, 2012
The situation few minutes ago: image and what is on for now: image I am not watching at my charts all the time as required so I can not say - those trades will be profitable or not ... besides, M1 timeframe is not good one for this kind of ...
Trendline breakouts
- newdigital replied Dec 18, 2012
"ready to go" for EURUSD now: image I will upload MaksiGen indicator multi timeframe version with template if someone is interesting - I am using MaksiGen indicator by default settings for M1 timeframe and MaksiGen indicator MTF M5 settings for M1 ...
Trendline breakouts
- newdigital replied Dec 18, 2012
I name it "ready to go" à la Warcraft
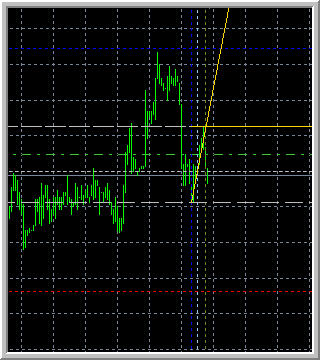
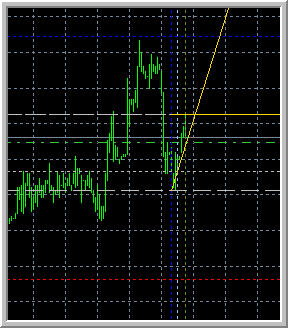
Trendline breakouts image What does it mean? When all support/resistance lines and tl came very close to each other with the price in the middle so ... we can expect breakout soon. Price is telling to you: "ready to go" ...
- newdigital replied Dec 17, 2012
Price is trying to cross this line, we see it? image if the price will cross this line so price will go down for some more ... pips for example. It is just nothing for M1 timeframe but if we will use it on H4 or D1 - it may be good profit.
Trendline breakouts

- newdigital replied Dec 17, 2012
Lower trendline was crossed by price. Downtrend image
Trendline breakouts
- newdigital replied Dec 17, 2012
It is the situation for now: image Where the price will go? It depends on which trendline will be crossed by price ...
Trendline breakouts
- newdigital replied Dec 17, 2012
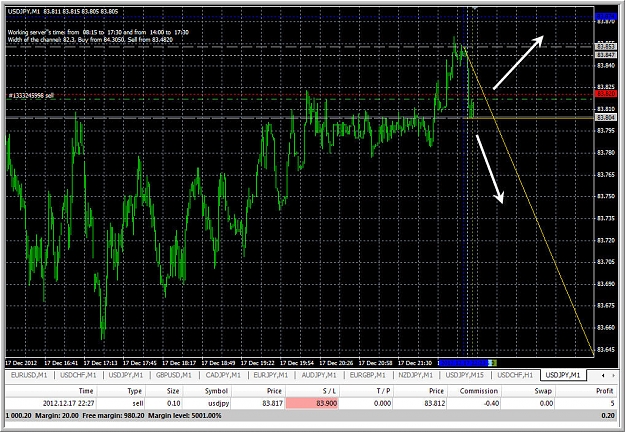
It is the situation for right now (I opened sell) ... but where the price will go to for now? image
Trendline breakouts
- newdigital replied Dec 17, 2012
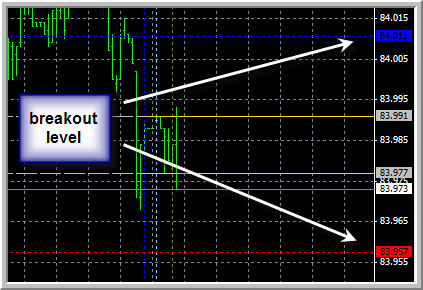
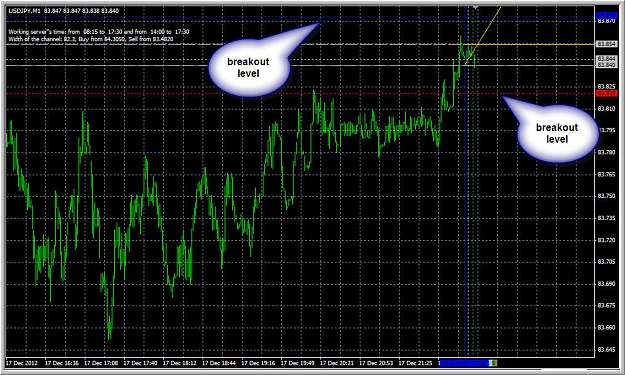
This is USDJPY for now as an example - we see breakout levels, besides - the price break one trendline ... I do not remember the name of this price pattern when the price is inside the cross created by 2 trendlines ... cross? so if the price will go ...
Trendline breakouts
- newdigital replied Dec 16, 2012
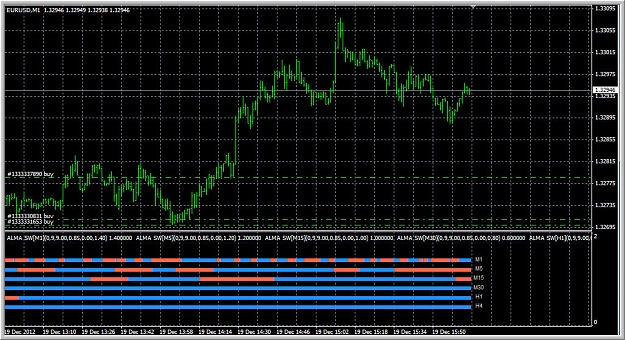
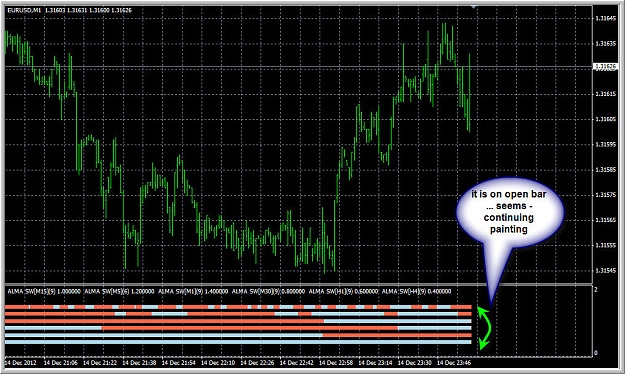
well It is ALMA_v1 SW indicator from this post. I just used different IndicatorValue in input (from 1.40 up to 0.4) - see image attached: image I mean - it is on open bar, right? So, it can be used for information only ... MTF is continuing ...
Arnaud Legoux Moving Average - ALMA
- Posts by Member Search: 'newdigital'