- Search Energy EXCH
- 12 Results

- mry2001 replied Feb 20, 2013
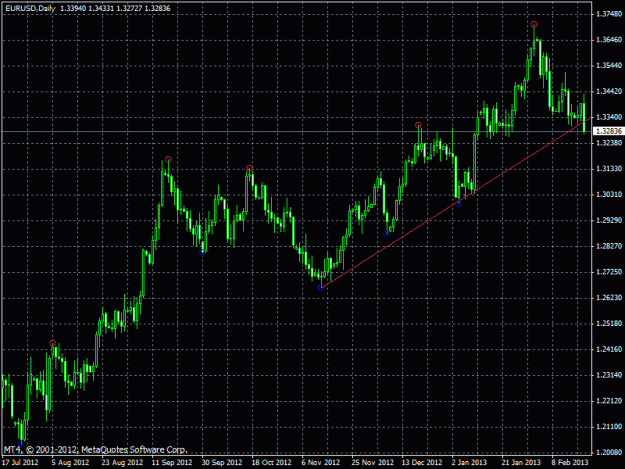
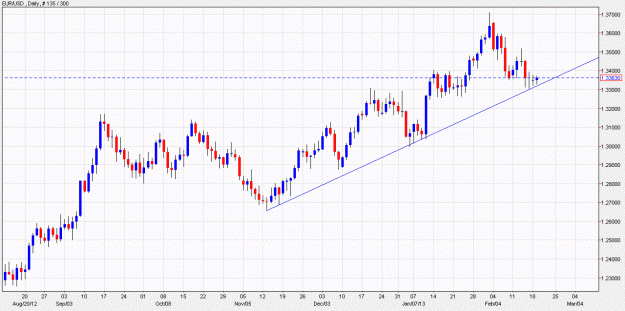
Finally the trendline broke. This is expected. The bullshit run above 1.34 puzzled me and I do not understand why eu is running upward.
Trading EURUSD only
- mry2001 replied Jan 26, 2013
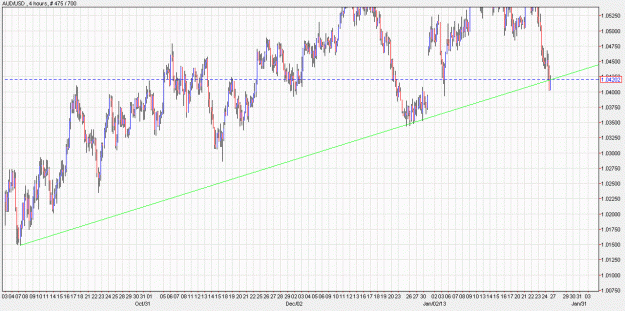
It did close below on 4h chart. You can still argue that there is no sure thing on forex market. It can bounce back to break 1.06 after it close below 1.03. That is true. Anything can happen so we always take loss.
Aussie Trading Room and Cartoons Gallery
- mry2001 replied Jan 26, 2013
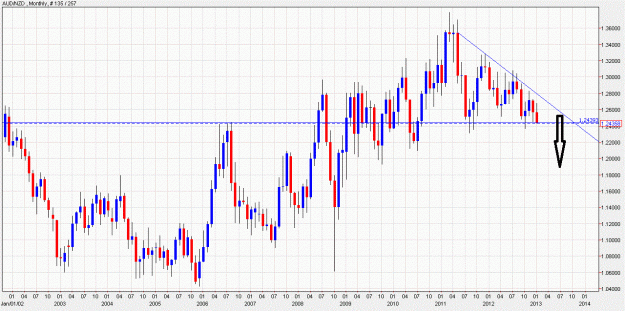
This is a picture of AUDNZD. I am going to hold a very small short position for long term because there is no stop loss.
Aussie Trading Room and Cartoons Gallery
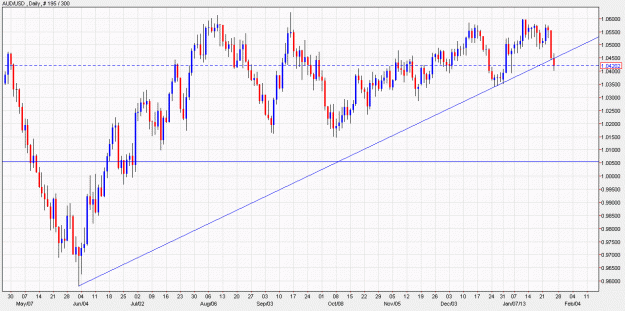
- mry2001 replied Jan 26, 2013
This is what I see on daily chart. The long term support trend line is broken.
Aussie Trading Room and Cartoons Gallery
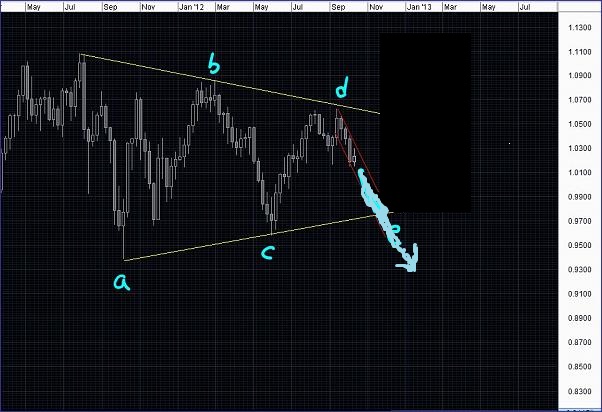
- mry2001 replied Dec 29, 2012
It is also possible that au exit the triangle from the down side. Both sides should be carefully watched.
Aussie Trading Room and Cartoons Gallery
- mry2001 replied Dec 29, 2012
In near term, usd is strong. The strength may continue into january. Please check spx500 and the gold, which are correlated to au. I agree usd should be weak because of q3 and q4. but not against JPY and AUD. Japan's problem and china's hard landing ...
Aussie Trading Room and Cartoons Gallery
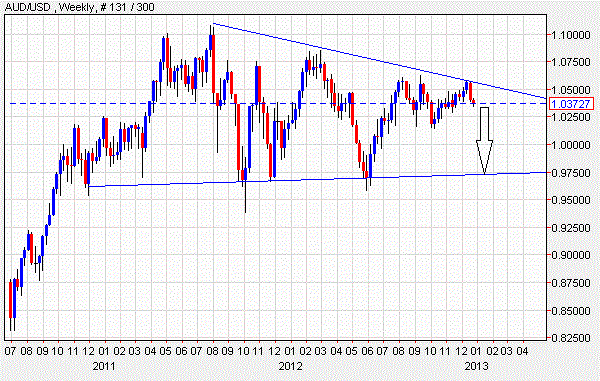
- mry2001 replied Dec 22, 2012
Next week. The trend line and support is broken.
Aussie Trading Room and Cartoons Gallery
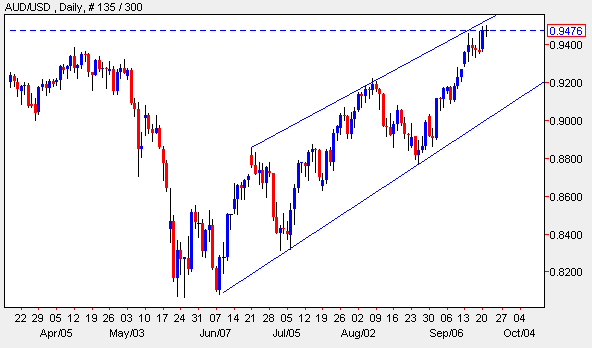
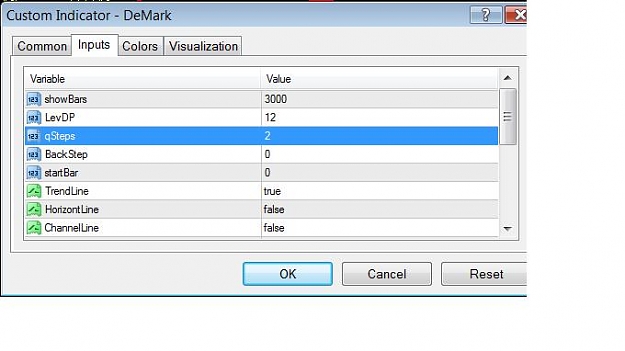
- mry2001 replied Sep 19, 2010
I use demark on daily chart. I set LevDP=12. This is the most important parameter. So demark finds the point higher(or lower) than 12 days before and after on the daily bars. I also try it on the weekly chart and it shows very nice entry signals. My ...
USD/JPY Discussion
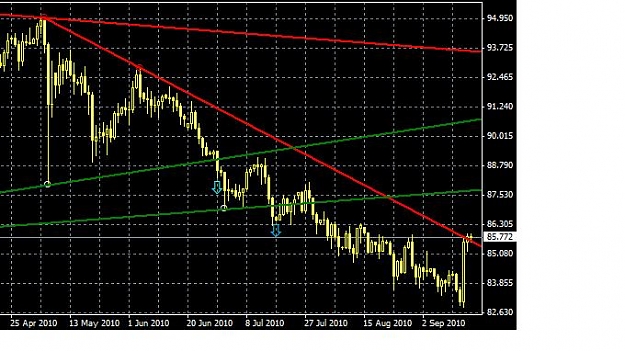
- mry2001 replied Sep 18, 2010
Here is my chart: The lines are drawn by demark indicator. I am waiting for a buy signal.
USD/JPY Discussion
- Posts by Member Search: 'mry2001'