- Search Energy EXCH
- 84 Results
-
 mnmnmmnnmnmn replied Aug 3, 2020
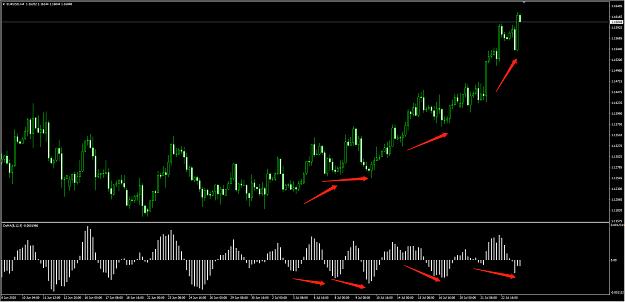
image this pattern is strictly against many rules or principles. but osma get negatively bigger and bigger, this also shows something.
Hidden divergence
- mnmnmmnnmnmn replied Aug 2, 2020
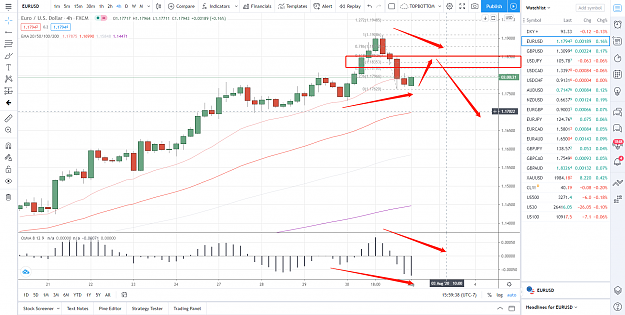
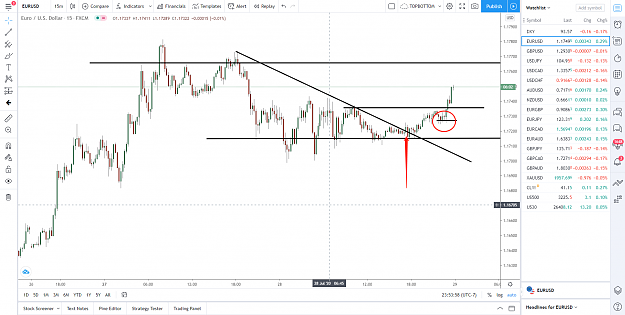
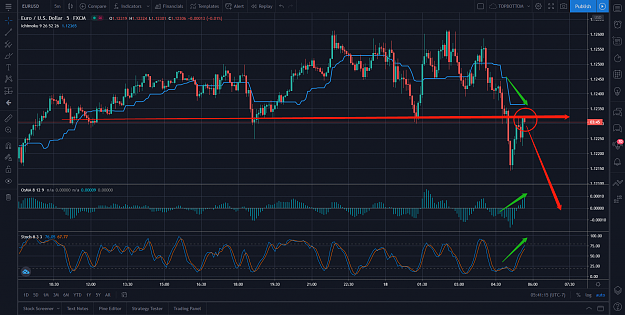
image Not sure if your MACD is up close to zero or not. Price has broken the 15m structure previous high. Looks like H4 20 is holding. Now price should keep going back up to the 50% zone and sell off again if it fails to going higher.
Hidden divergence
- mnmnmmnnmnmn replied Aug 1, 2020
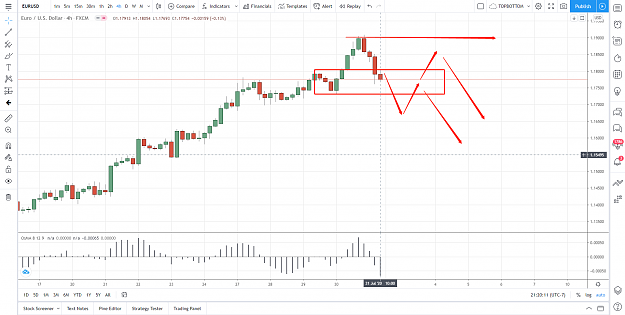
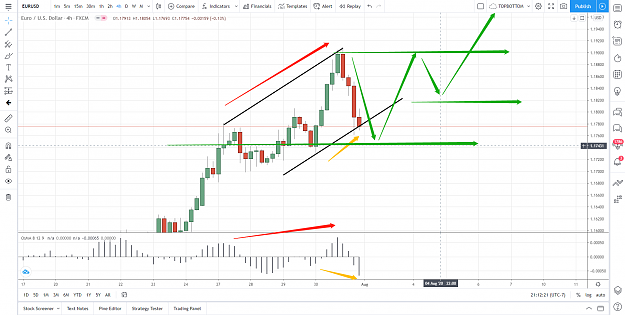
image image Price will consolidate for a while on monday then we 'll see which way it breaks out. But i strongly believe the big train of EU has already started, and when something massive like this starts rolling, the strong momentum willl keep ...
Hidden divergence
- mnmnmmnnmnmn replied Jul 31, 2020
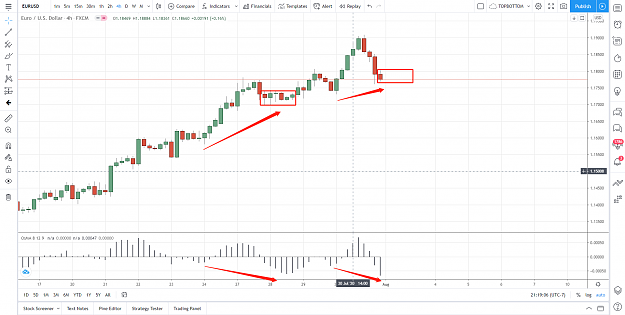
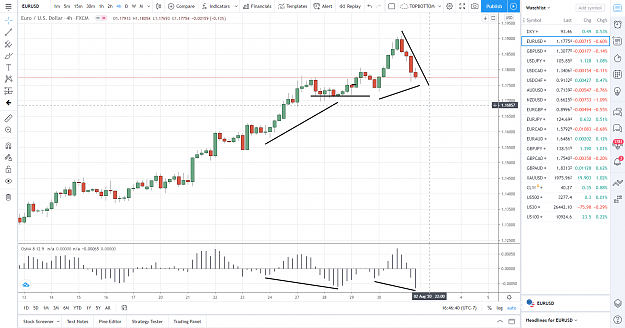
image healthy pull back on EU H4? we don't know yet. might be. since it's the end of the week and also end of the month especially large positions consolidated for institutions. Will we see a shooting back up next week?
Hidden divergence
- mnmnmmnnmnmn replied Jul 29, 2020
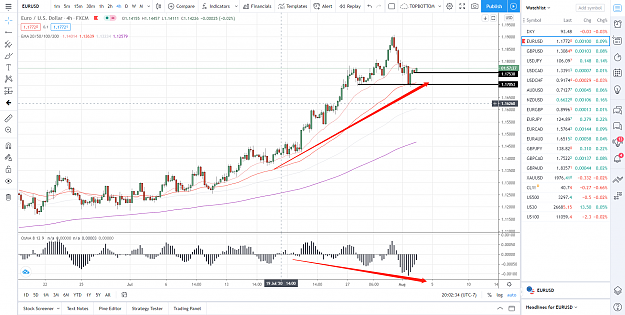
image entered on the retrace after price broke out of the trend line. good luck.
Hidden divergence
- mnmnmmnnmnmn replied Jul 23, 2020
image With US covid chaos keeps getting worse and worse. it's very obvious shorting USD is a trend now. I have caught all four major HD patterns so far. And there will be more to come as the cup and handle has formed in long TF.
Hidden divergence
- mnmnmmnnmnmn replied Jun 18, 2020
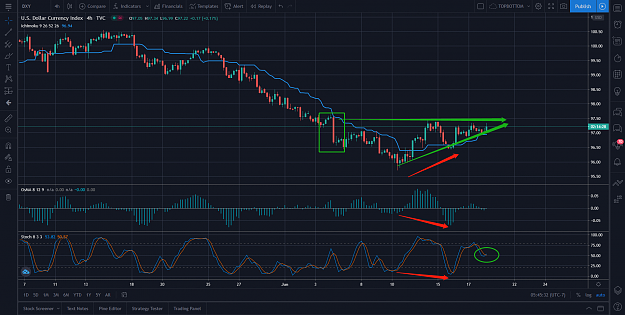
image To support my analysis by looking at dxy. you can have a pretty much a good guess. If you guys know what I mean here.
Hidden divergence
- mnmnmmnnmnmn replied Jun 18, 2020
image EU 5M. Retest. Time for a little bit PA analysis. DXY set up for triangle break out. All the non US is supporting this fact. Jobless Claim number just came out. I am hoping to see a bearish candle pattern right here.
Hidden divergence
- mnmnmmnnmnmn replied Jun 18, 2020
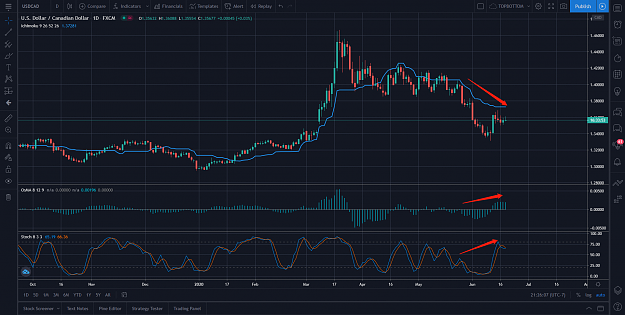
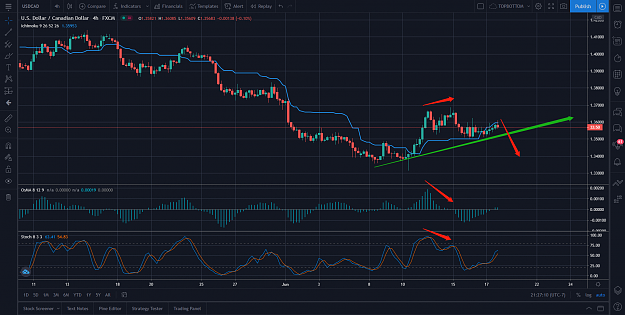
image image CAD daily charts shows strong signals. Do not let it go this opportunity. US is still in trouble, Powell said inflation is still so far away.
Hidden divergence
- mnmnmmnnmnmn replied Jun 18, 2020
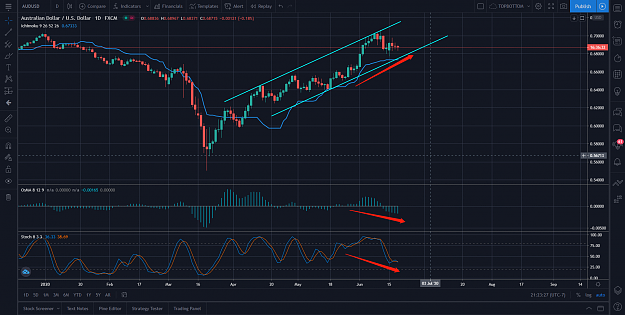
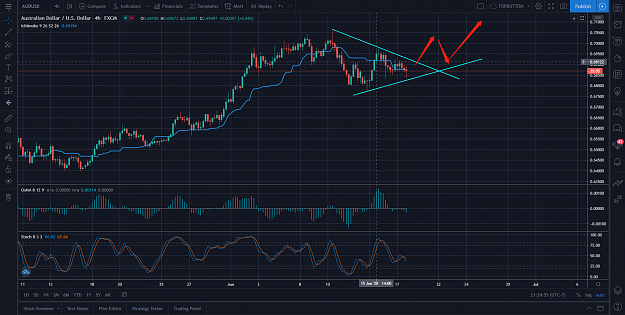
I'm bored today. Did some analysis on the majors. Aussieeee.... image image
Hidden divergence
- mnmnmmnnmnmn replied Jun 18, 2020
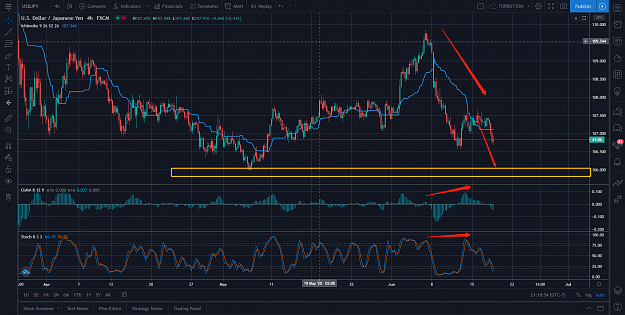
Same as UJ, still undergo the downtrend. I believe the target will be met in no time. image
Hidden divergence
- mnmnmmnnmnmn replied Jun 18, 2020
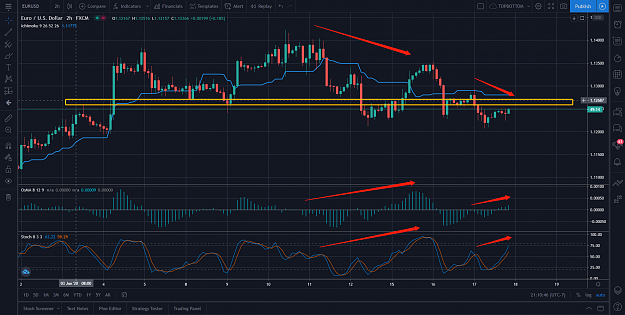
Chamane, Hope you have pocketed some profit from the last drop two days ago. Now as we can see on the chart. GU has news tonight and EU will be affected also. I believe on this one your macd will give you the final signal for entry real soon in ...
Hidden divergence
- mnmnmmnnmnmn replied Jun 16, 2020
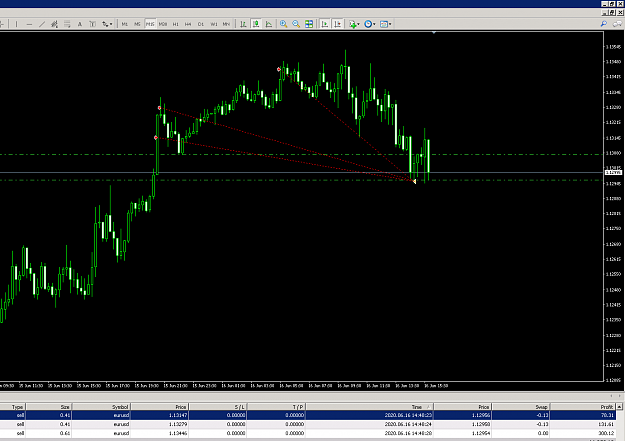
image Set up my tiny mini sell grid with stop loss over 1.1350 and went to bed before euro session opened up last night. Now pocketed all profits.
Hidden divergence
- mnmnmmnnmnmn replied Jun 16, 2020
image Now we are at weekly resistance level, and currently in the ABC correction with B finished (hopefully if im correct) at 618 level. Looking for reverse pattern in H1 as H4 already gives us HD signal.
Hidden divergence
- mnmnmmnnmnmn replied Jun 5, 2020
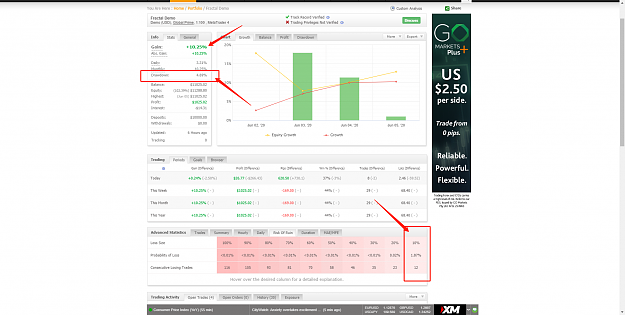
image I use myfxbook risk of ruin to see the chances that I can stay within the 10% rule. As it shows 10%/1.87%/12, which means there is less than 1.87% chance of losing 10% and it'll take me 12 consecutive loses which I don't think i'll ever get. ...
FTMO - For serious traders
- mnmnmmnnmnmn replied Jun 5, 2020
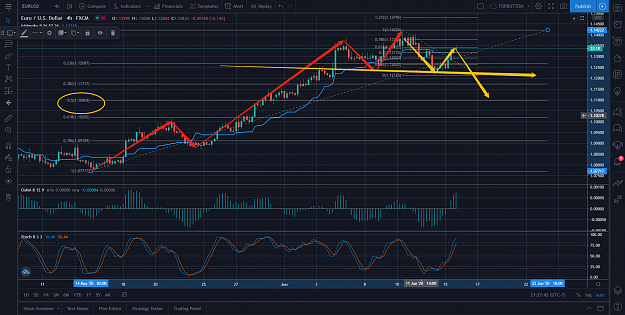
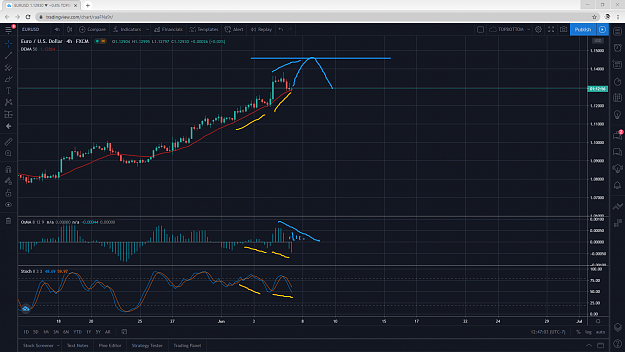
image Not trying to predict the market but this kinda pattern is pretty often to be seen everywhere. next push up to the critical level around 1.14, then RD shows up. everyone starts to unload.
Hidden divergence
- mnmnmmnnmnmn replied Jun 5, 2020
image This is the point that i can call it a double down situation. MA well holding, HD pattern shows up. Draw the trendline, then boom !
Hidden divergence
- mnmnmmnnmnmn replied Jun 5, 2020
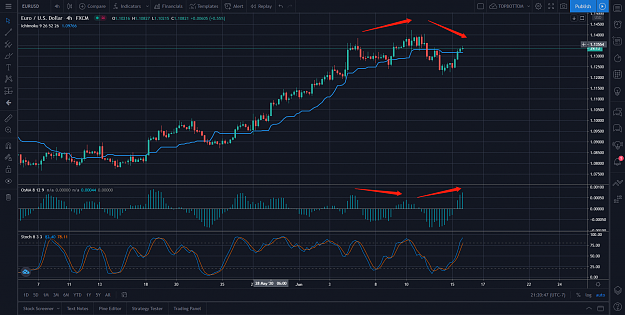
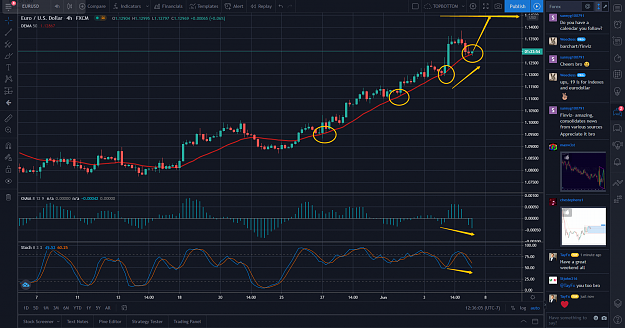
image I don't know about you guys. As a trend trader right here, obviously it's holding the MA. and at the same divergence showed up perfectly and next week targetting 1.14+ Today's sell off is just the banks unloading their stock before the ...
EURUSD
