- Search Energy EXCH
- 29 Results (1 Thread , 28 Replies )
-
 mathematician replied Nov 11, 2015
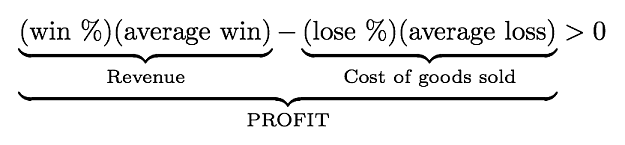
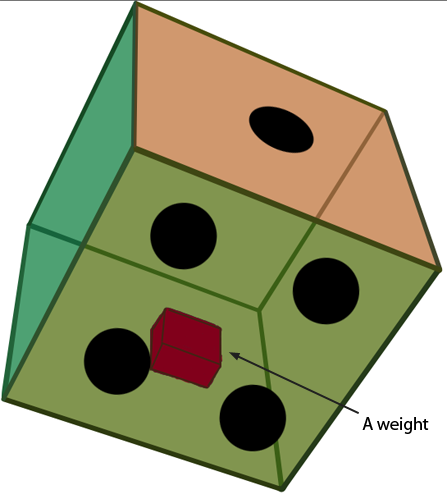
As you can tell from my last post, I think there are actually a lot of similarities -- if you trade like the house. Well, yes, I guess every participant is "gambling" in the sense that no one knows with 100% certainty what will happen next. It's ...
What are similarities between trading and gambling?
- mathematician replied Nov 10, 2015
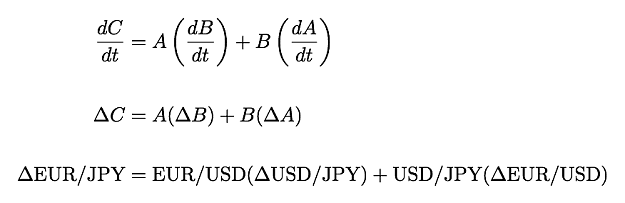
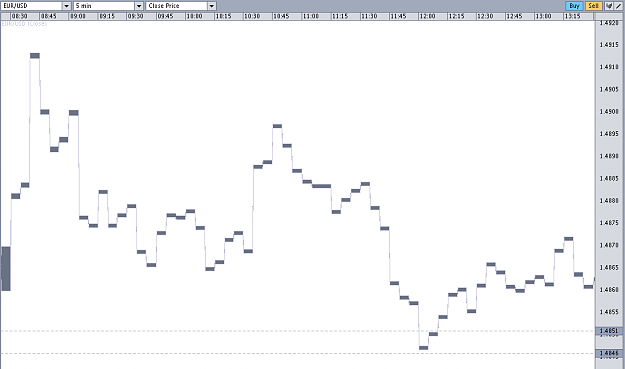
That's a great observation! Again, I'm afraid it won't really shed much light on where any currency is heading in the future, but I can explain why you're seeing this phenomenon. Are you familiar with calculus at all? Even just high school or ...
Mathematical Relationship between Forex pairs
- mathematician replied Nov 9, 2015
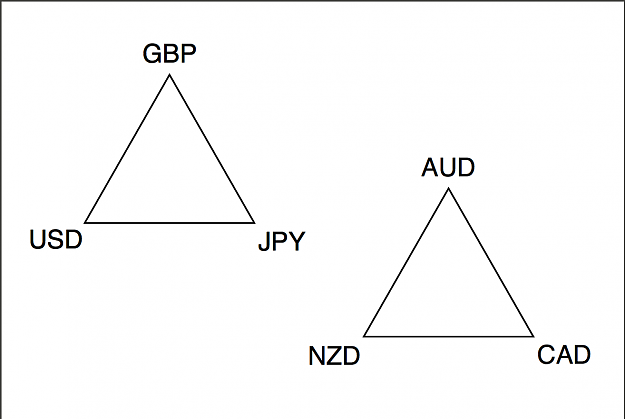
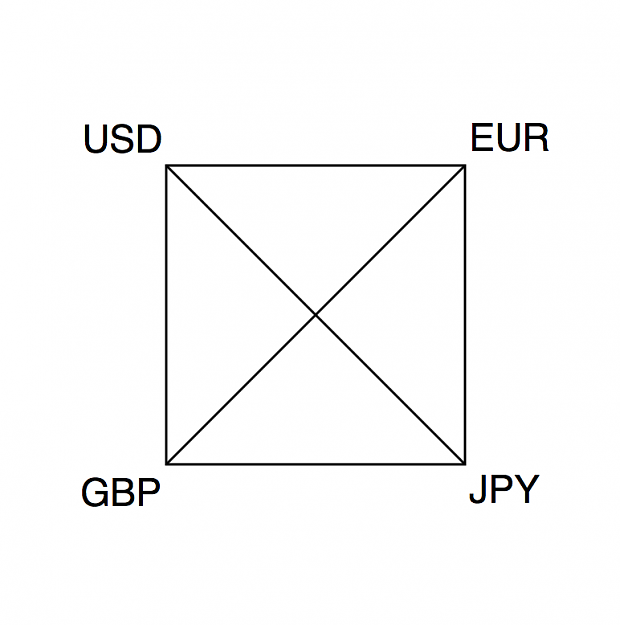
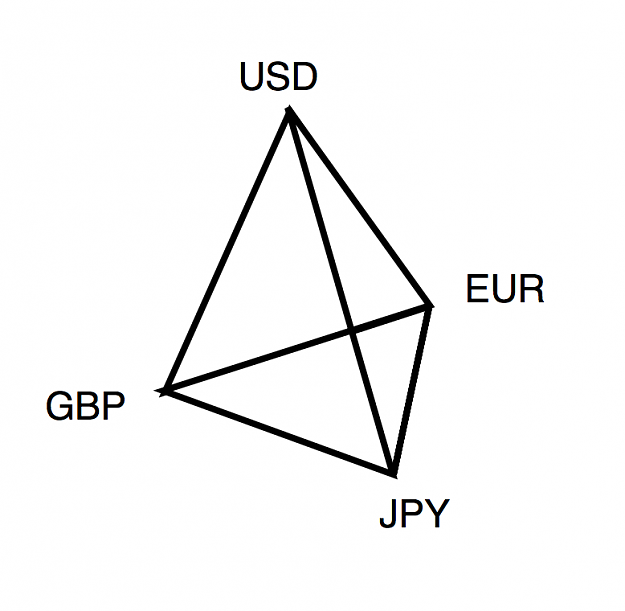
Another thing I considered for a while was to only focus on one currency triangle, i.e. say you're interested in GBP, USD, and JPY: Trade the GBP/USD, the USD/JPY, and the GBP/JPY. What I like about that idea is that because of the relationship ...
Mathematical Relationship between Forex pairs
- mathematician replied Nov 8, 2015
That is interesting, alphaomega. I don't see why he's plotting some things in the negative quadrants because all the exchange rates are positive, whether you take the reciprocal or not. But I do see why those points all have the same slope (when he ...
Mathematical Relationship between Forex pairs

- mathematician replied Nov 8, 2015
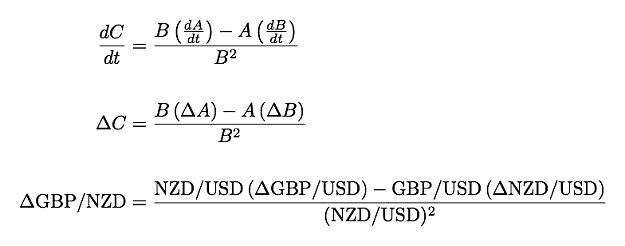
Here are the basic rules in a more mathematically-friendly notation: image image In fact, it is because of these rules that currency pairs are written as little fractions, like GBP/USD.
Mathematical Relationship between Forex pairs


- mathematician replied Nov 7, 2009
First of all, let me say that I don't really think prices are random. At the end of the day, thought, I suppose I really have no idea because I don't have any hard proof one way or the other. Not necessarily true. You can see "trends" in randomly ...
Inescapable Truths
- mathematician replied Nov 6, 2009
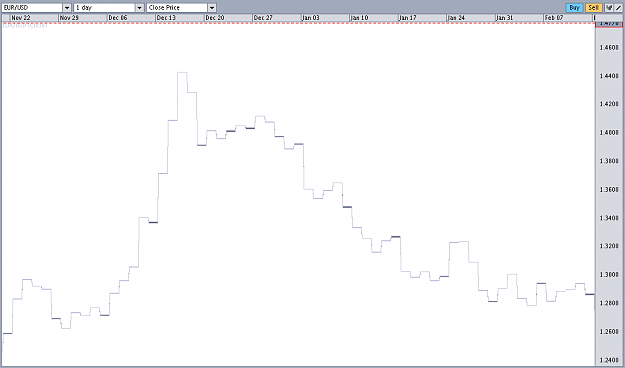
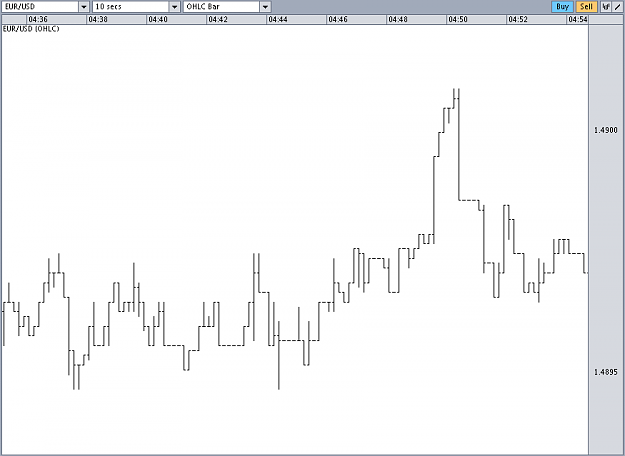
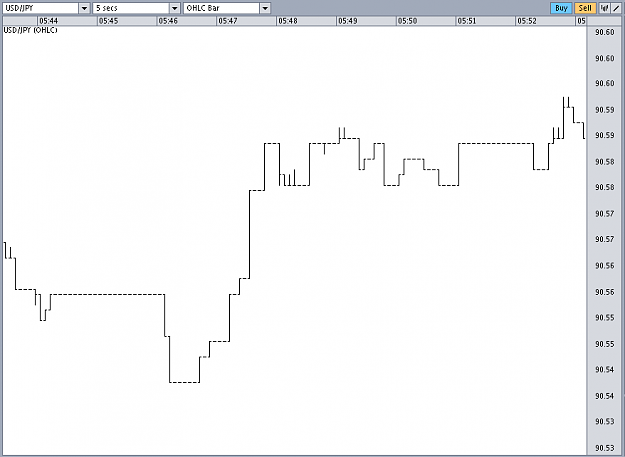
Why Time Frame Matters — There are basically two main reasons why I think it's better to trade the longer time frames: Transaction costs become less troublesome. It allows you to focus on the substantial moves. 1. Transaction Costs In the very ...
Inescapable Truths
- mathematician replied Nov 6, 2009
Hello nubcake, welcome! First of all, let me say that I understand you're just sharing your thoughts; that's what this is all about. That's why I posted this thread in the "Discussion" section. That being said, it seems you and I disagree on many ...
Inescapable Truths
- mathematician replied Nov 5, 2009
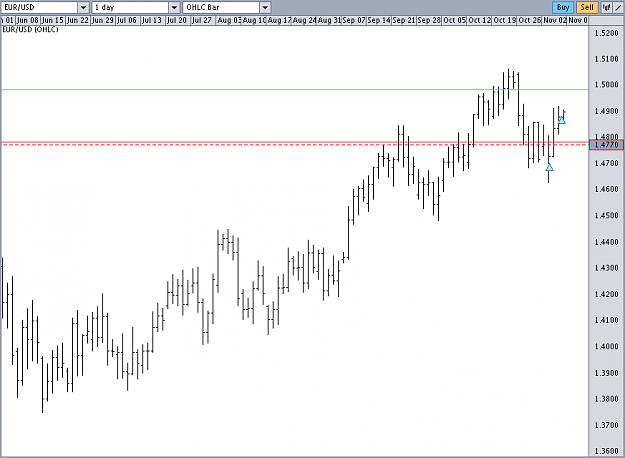
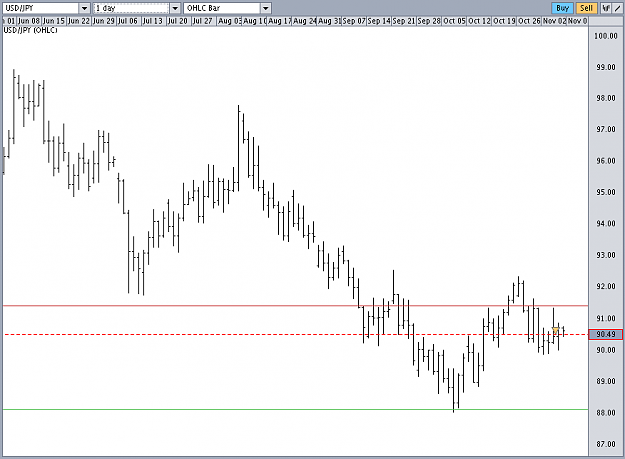
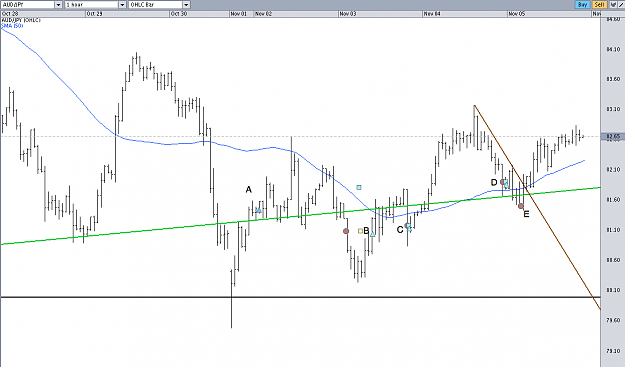
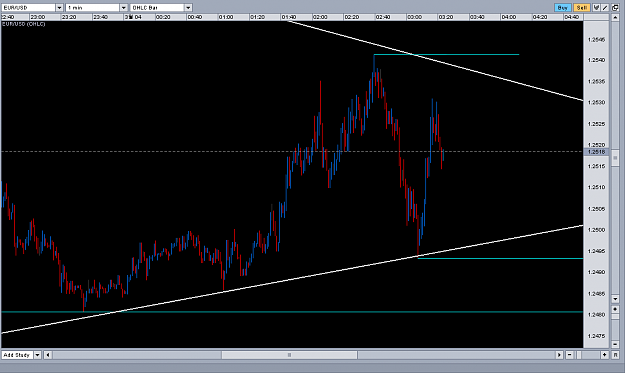
Yes! One thing I've noticed recently about my trades is that I should probably use a wider stop. I would not get stopped out so much, and I would stay with the move longer. Look at the attached chart. The green trend line comes from the daily chart. ...
Inescapable Truths
- mathematician replied Nov 3, 2009
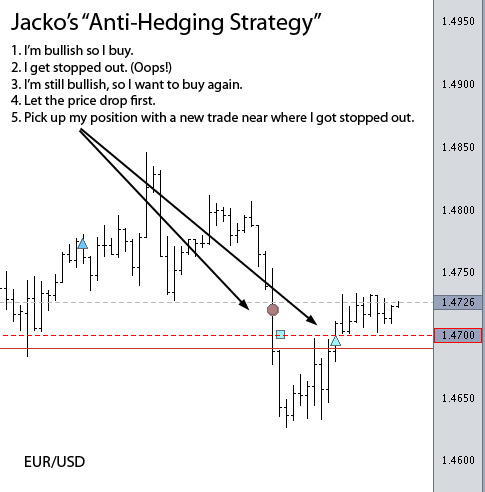
Jacko's "Anti-Hedging" Strategy — Did you use Jacko's "Anti-Hedging" Strategy? I was also bullish on EUR/USD, and I also got stopped out. I waited a little while. Then I placed a new order to enter at about the same price where I got ...
scratch's first trading steps ...
- mathematician replied Mar 25, 2009
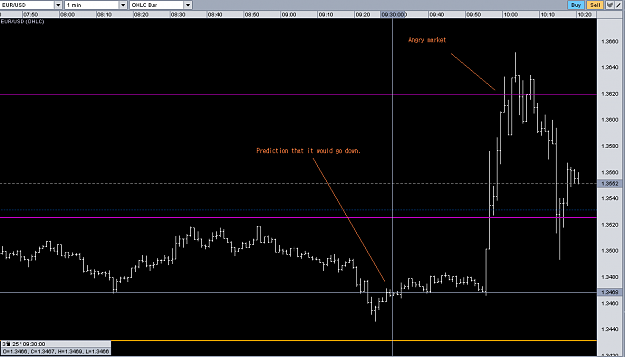
Prediction. Hah! — I think the market got angry at me for trying to make a prediction.
Trading setups around SR Zones
- mathematician replied Mar 24, 2009
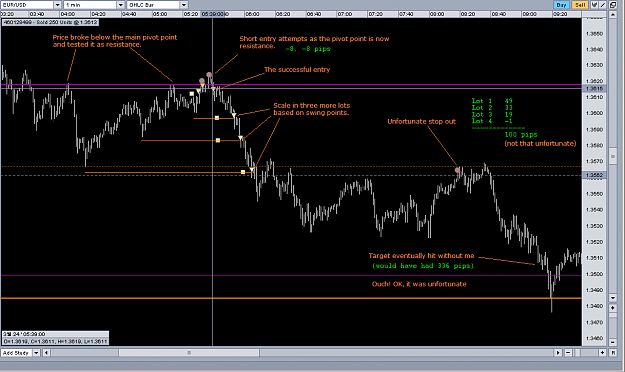
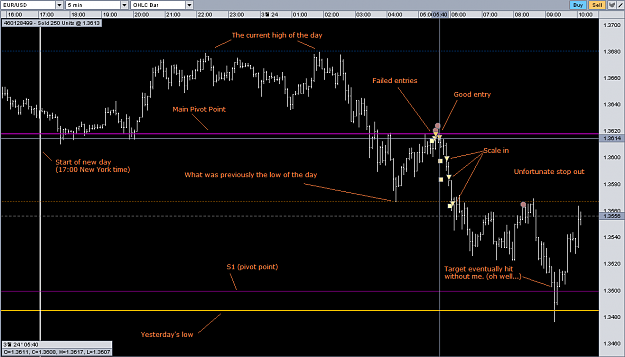
Bittersweet Trade — Well I made a great trade today (made 100 pips
Trading setups around SR Zones ), but it could have been over 3 times better.
  It was an unfortunate early stopout after a large retracement. Nevertheless, it was scaling in that turned a good trade into ...
- mathematician replied Mar 19, 2009
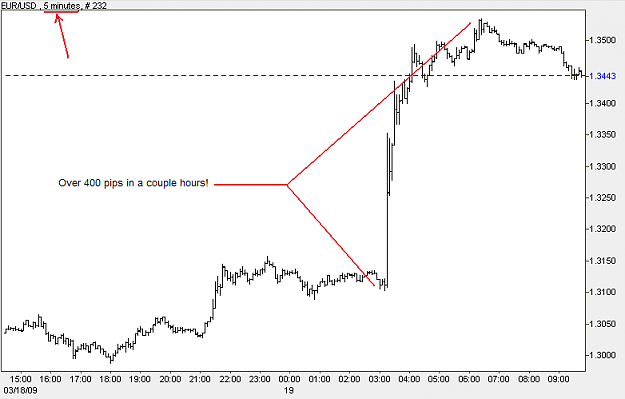
Wow! — I've never seen such a big move in such a short time for EUR/USD! Wish I had been there...
Trading setups around SR Zones
- mathematician replied Mar 18, 2009
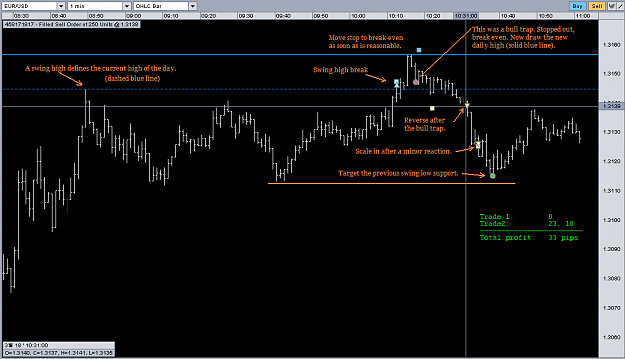
Swing Points at Daily High/Low — Sorry I've been hogging the board today.
Trading setups around SR Zones I'm continuing my research and trading with swing points. I took what I was doing before (trading swing point breaks) and combined it with the idea of ...
- mathematician replied Mar 15, 2009
More Swings — Here I've marked swing lows in red and swing highs in blue. Notice how during the trend, there is a perfect alternative red, blue, red, blue, ... through time. However, during the range, sometimes there will be two reds in a row ...
Trading setups around SR Zones
- mathematician replied Mar 14, 2009
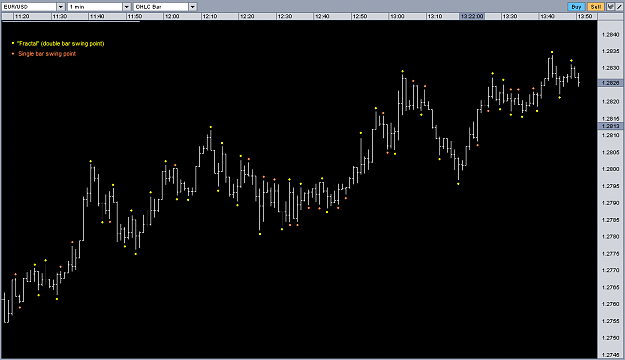
Swing Points — I've been using swing points to define support and resistance. Here's a chart with single bar swing points and double bar swing points (sometimes called "fractals" but I don't like that term because it means something quite ...
Trading setups around SR Zones
- mathematician replied Mar 10, 2009
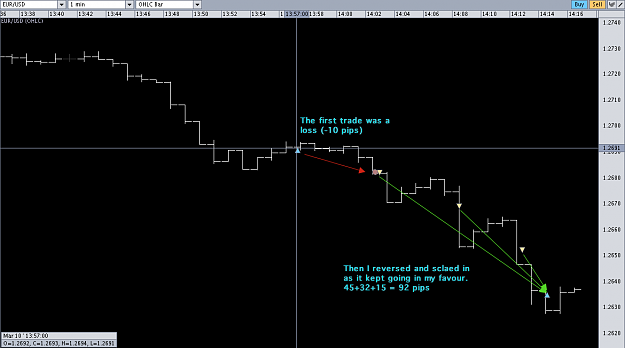
I Love Scaling In! — My first trade was a loss. No problem, I was wrong, just reverse. My next trade went well so I added in. That went well too, so I added in another. That went well too. I got excited and closed all my positions. The first ...
Trading setups around SR Zones
- mathematician replied Mar 4, 2009
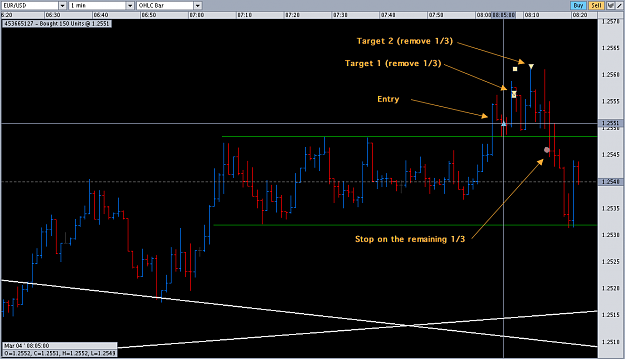
Scaling Out — Take a look at this range breakout trade. I scaled out 1/3 of the position at +5 pips, then another 1/3 at +10. Then I moved my stop up a bit closer. In this particular trade, the news came out and price dropped. I lost 5 pips on ...
Trading setups around SR Zones
- mathematician replied Mar 4, 2009
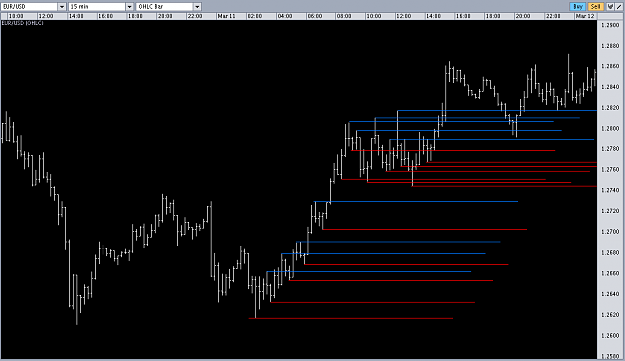
My areas of interest — These are my areas of interest so far. the white lines are trend lines from the 15-min chart. The blue lines are what I believe to be pivotal points in the Jesse Livermore sense of the word. I prefer to have a hard, fine ...
Trading setups around SR Zones
- mathematician replied Mar 3, 2009
Pivots and Pivotals — I thought I would repost this chart from the other thread. It belongs here. url
Trading setups around SR Zones
![Click to Enlarge
Name: Pivots%26Pivotals[1].PNG
Size: 25 KB](/attachment/image/212704/thumbnail?d=1365563869)