- Search Energy EXCH
- 150 Results
-
 manojsai replied Oct 11, 2010
price seems to play around the yellow channel........ will this GAP be known as the exhaustion gap for the current trend?.
EURUSD
- manojsai replied Sep 23, 2010
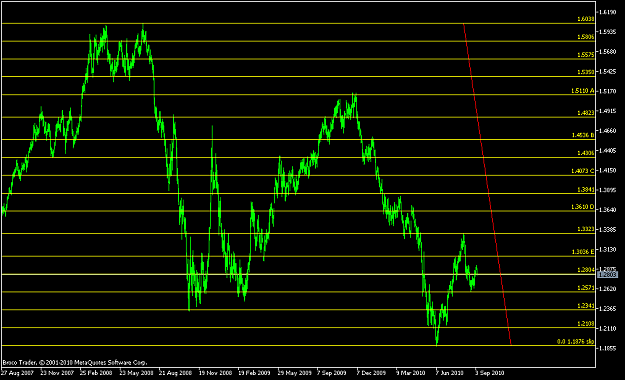
my tools are trendlines and past S/R lines..... that yellow line is the trend for this rally and price has broken it at 3364 area. however i dont expect this downward spike to last longer. maybe up to 3220 area before rallying . if 3364 is taken up ...
EURUSD
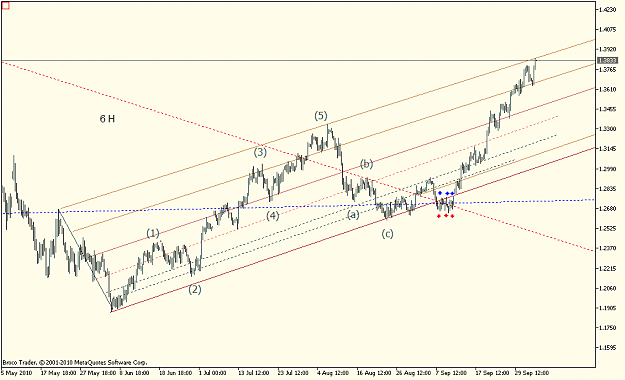
- manojsai replied Sep 14, 2010
Long eur since 2857 adding up. first resistance 2942 and target 1. second target 3025. positions at BE.
EURUSD
- manojsai replied Sep 13, 2010
no position atm. things looks very unclear....the 2H chart clearly indicate were the market should move,but hell it follow its rules. has put a sell order at 2829 sl 10 pip target 2744.
EURUSD

- manojsai replied Sep 12, 2010
My trading plan for this week. This week things look a bit hazy,the last 30 pip drop has left the short term bulls scratching the head.The sharks on vacation should be in their desk this week and i hope to get the critical volume to move the market ...
EURUSD
- manojsai replied Sep 11, 2010
Bride from my place..... more the gold,the better..............more the gold price increase,still better..........
EURUSD

- manojsai replied Sep 9, 2010
DO OR DIE...THE FINAL BATTLE In daily as a per ichimoku ,Bar is at the last possible level of the cloud.........its last resistance..... expect a range play at this level for some time. ichimoku chart in daily is followed by many sharks.
EURUSD
- manojsai replied Sep 8, 2010
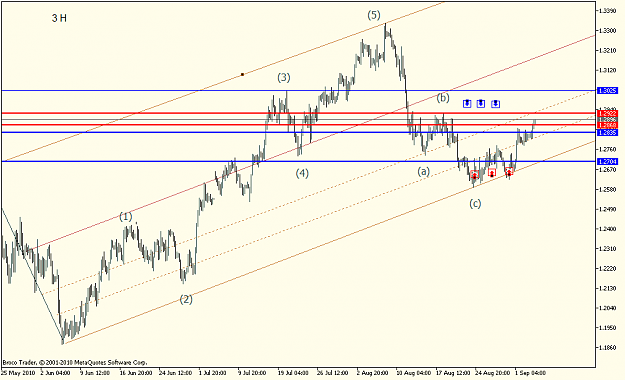
this is the update on the wedge...... that red line was perfect resistance line. watch the yellow line carefully. it is around 2704. the market can come back to that level and shoot again up..... if it break down the bull is dead.................
EURUSD
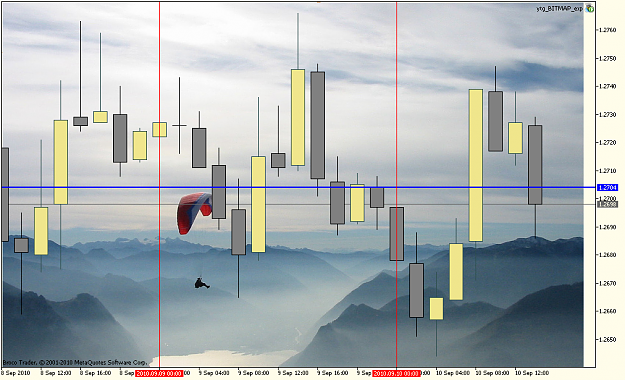
- manojsai replied Sep 8, 2010
Time to talk about a Falling wedge which is a bullish pattern. watching the yellow line,for any break. watching how it break 2710. no position atm.
EURUSD
- manojsai replied Sep 6, 2010
break of blue at 2855 should have been the place to put my short........hell,i was sleeping.
EURUSD
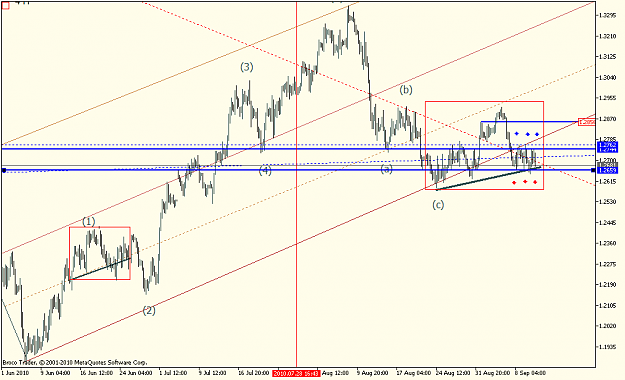
- manojsai replied Sep 5, 2010
My last week plan. I am a small daytrader with a limited fund and my weekly and daily trading plan helps me in not chasing the price. i could sell my longs near my target of 2890. This week i have a neutral view and react to the market as it moves. ...
EURUSD