- Search Energy EXCH
- 6 Results
- lovepips replied May 15, 2012
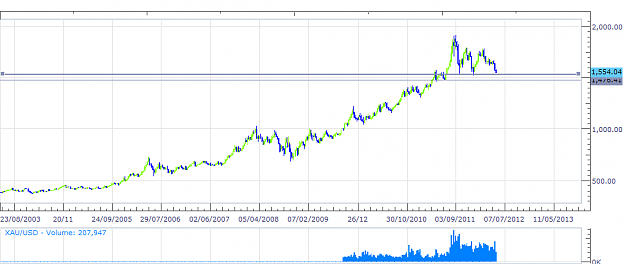
hi whatfx, ok I had a look at the 10yr chart - see attached. what do you think? two possible outcomes: 1. bear move continues south past the highlighted range... or 2. due to dodgy fundamentals over the next few weeks/months, investors opt for gold ...
XAU/USD & XAG/USD - Gold & Silver Traders Thread
- lovepips replied May 15, 2012
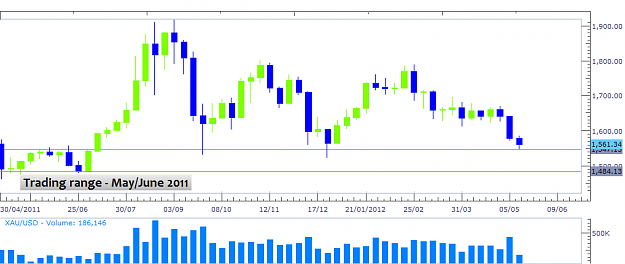
Hi lilpip, I had a look at the weekly charts for the last year and interestingly gold traded between the 1485-1545 range for much of May/June - by the end of June it started rising and reached over 1900 by start of Sept. It wouldn't surprise me in ...
XAU/USD & XAG/USD - Gold & Silver Traders Thread
- lovepips replied May 9, 2012
The price action today was very interesting. We had massive volumes (highest daily volumes for all 2012) and yet relatively low spread. The bears weren't able to get down past 1579. Price hasn't traveled very far north and still under the 1600. Will ...
XAU/USD & XAG/USD - Gold & Silver Traders Thread
- lovepips replied May 8, 2012
1600 target reached :-) looking at the volumes and candlesticks, this could be a nice entry level for a long. I'm keeping an eye on usdcad, if the dollar retreats should be good for the long gold position - if it continues north we could see further ...
XAU/USD & XAG/USD - Gold & Silver Traders Thread
- lovepips replied Apr 29, 2012
Hi Tsar, This is my first post on this thread, and I would firstly like to say, well done for some very informative analysis. On price, yes price movement has been very bullish I wonder how long it will continue....?? Thursday the market opened at ...
GBP/USD and EUR/USD
- lovepips replied Apr 26, 2012
Hi folks, Yesterdays price/volume movement was very interesting. Price couldn't reach April 4th low and volumes increased - possible bull run beginning? If the bulls advance, next stops should be fib levels 38.2 & 50 - price ranges 1680-85 & ...
XAU/USD & XAG/USD - Gold & Silver Traders Thread
- Posts by Member Search: 'lovepips'