- Search Energy EXCH
- 13 Results
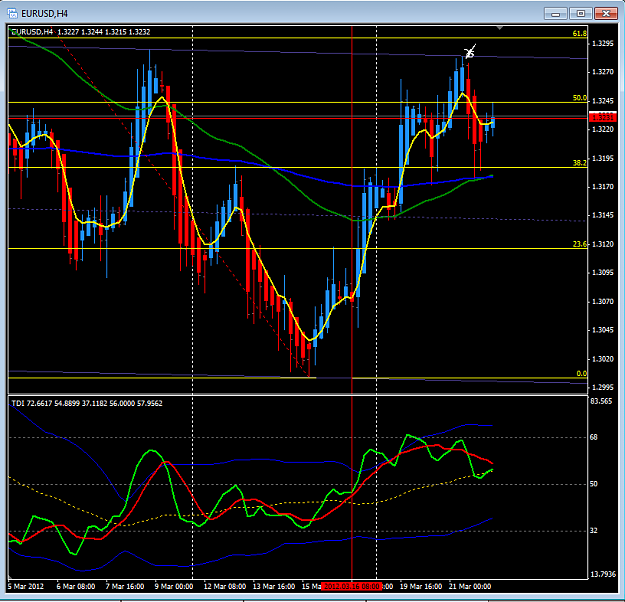
- ljin replied Mar 22, 2012
hello, i just notice that it is different than my chart. in my chart there is not a single pinbar at that time. do you know what went wrong? here is my chart
X-Man's Super Simple System
- ljin replied Mar 10, 2012
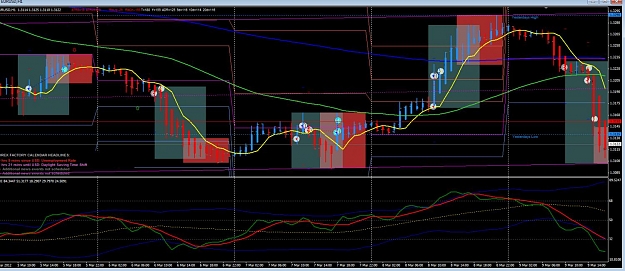
any screenshot on how you doing (entry and exit , profit or losses ) for this week? any update would be nice. this was mine. not that good trade. total only +32 profit
X-Man's Super Simple System . done 10 trades this week +25 pip -6 pip -17pip -5pip +1 pip +16pip -40 pip ...
- ljin replied Mar 6, 2012
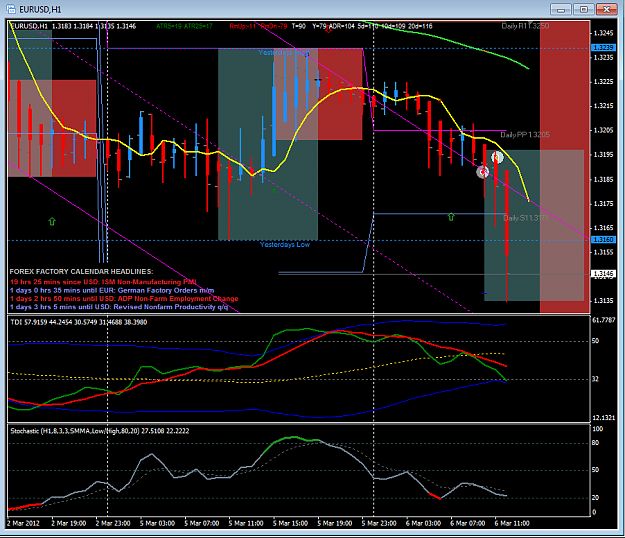
lol damn. if i werent close my trade. i get +50 pips by now. can all seniors here or master of this strategy like x-man,phx62, etc point where i get wrong? when i am open position ( i am waiting until the price get past prev low. is this a right ...
X-Man's Super Simple System
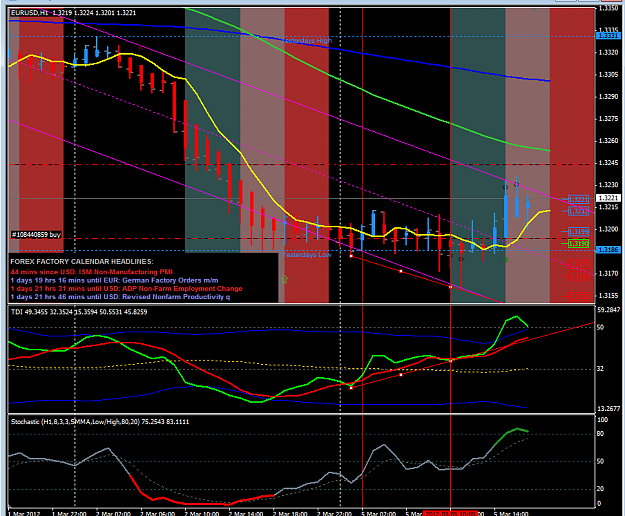
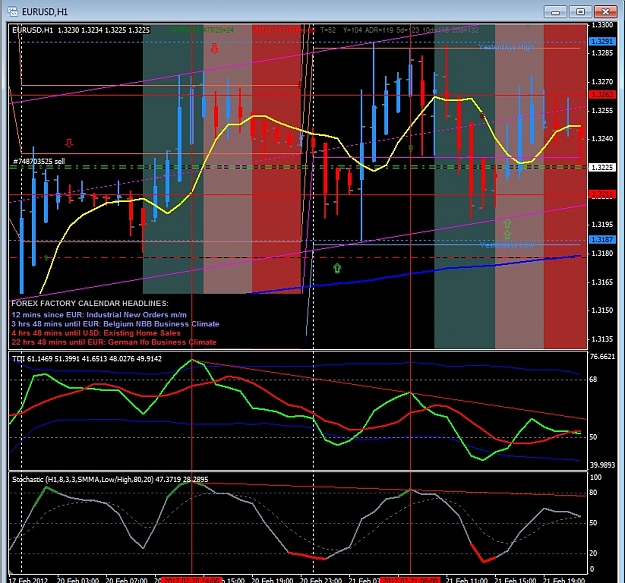
- ljin replied Mar 5, 2012
To all master of this system (phx62,x-man-lazylobster,emmanuel, and others senior). below is my chart and today's trade. could you guys see where did i do wrong ? at check sign ( usd news) . the story of entry: i open trade at 1.3194 (price going ...
X-Man's Super Simple System
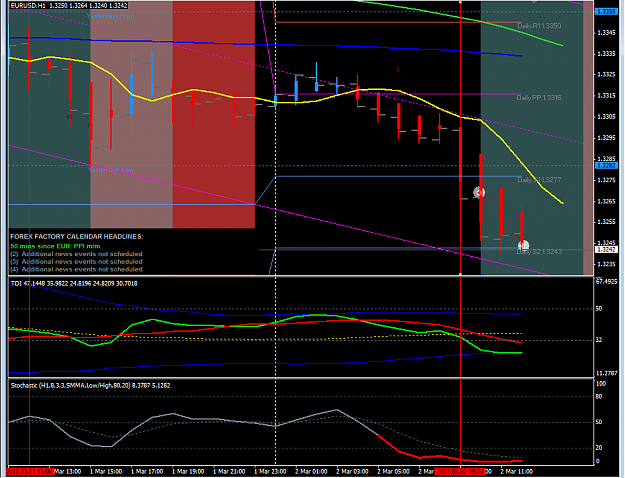
- ljin replied Mar 5, 2012
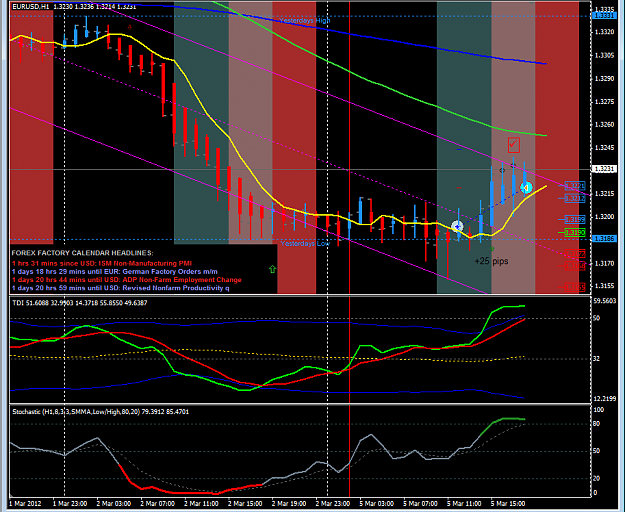
that is hidden bearish divergence i think. base on PA you could say that its time to go short. but weird. my chart didnt show that kind of divergence. my pa show bullish divergence and signaling to go long and not short. here is my chart on h1. you ...
X-Man's Super Simple System
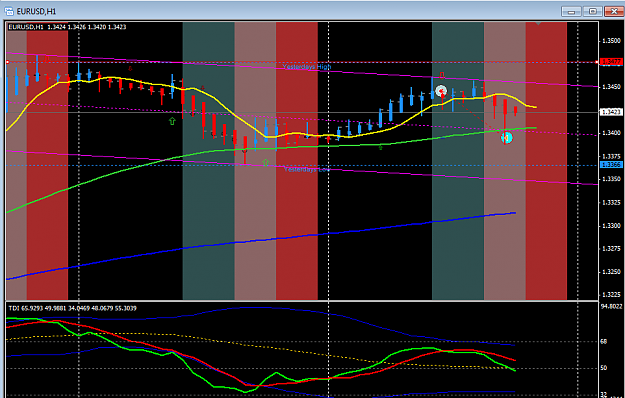
- ljin replied Mar 2, 2012
thanks (about possible of bullish divergence). make me notice that it is bad to stay on short. my original plan will wait until the price touch ema 200 and fib 50 on h4. but well, just close my trade for +25 pips because of that and it stuck on ...
X-Man's Super Simple System
- ljin replied Feb 28, 2012
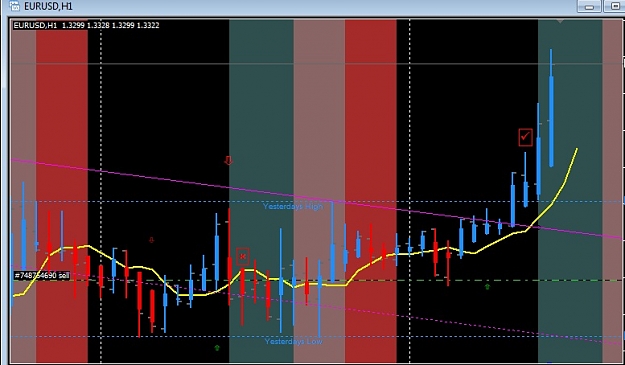
here is my trade today. +50 pips. not sure if i were doing it right or i perhaps i got lucky
X-Man's Super Simple System
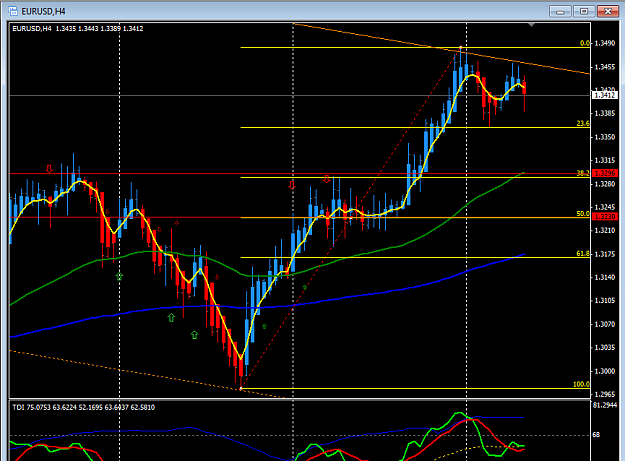
- ljin replied Feb 28, 2012
here is my daily channel on h4. lol i got lucky i guess. havent close my trade from LO . and hit my tp +50 then the price go up again
X-Man's Super Simple System
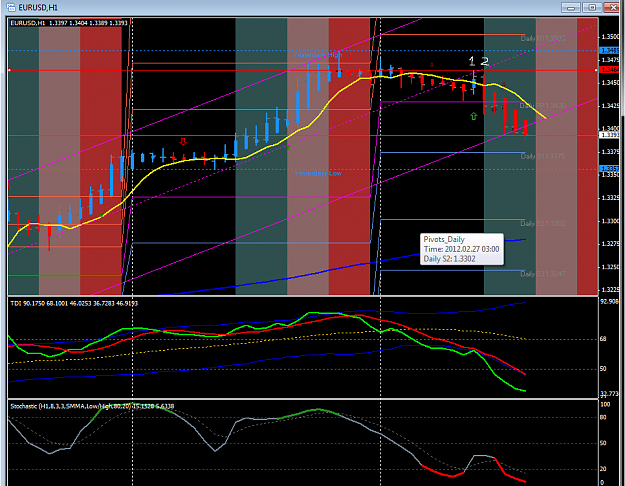
- ljin replied Feb 27, 2012
guys look at the chart i attached. at LO today(no 2) is strong bullish and TDI cross up. but after a few pips up, it goes down and made the TDI bounce and goes down(and become red candle ). so in this case. should we wait until either the price ...
X-Man's Super Simple System
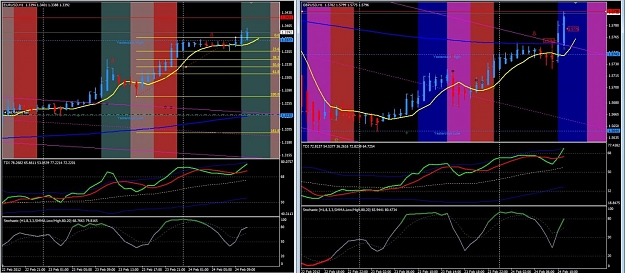
- ljin replied Feb 24, 2012
ah. i didnt read the news. here . left is e/u (i didnt enter because i feel the pa is not enough for me to go long yet) right is g/u. i enter after the pa move pass the ma
X-Man's Super Simple System
- ljin replied Feb 23, 2012
is this a pullback candle on sign icon? how about x sign? ( i think it is. but it suppose to be a doji in normal candlestick)
X-Man's Super Simple System
- ljin replied Feb 22, 2012
here. see the 2 vertical lines + TDI + stoch in my chart.
X-Man's Super Simple System
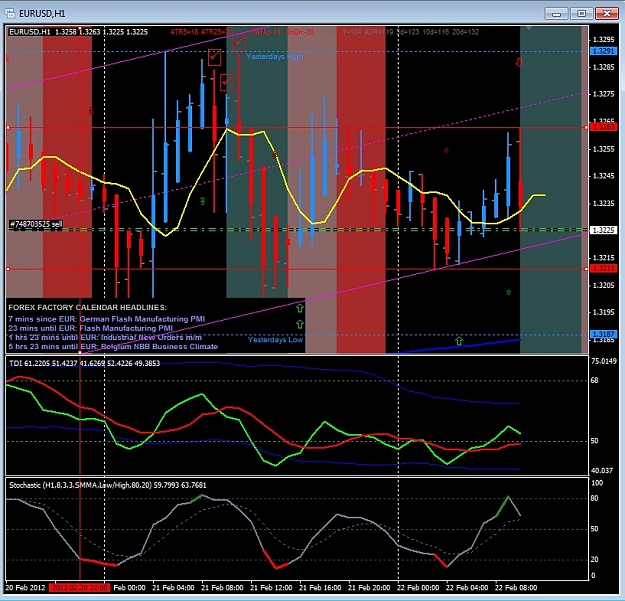
- ljin replied Feb 22, 2012
hello x-man and phx62 or any senior trader here, here is my e/u chart . i saw 3 pullback candles on the chart( mark with checklist icon above the candle . my question is : 1 . how can we spot that the pullback candle are a fake on 1st and 2nd ...
X-Man's Super Simple System
- Posts by Member Search: 'ljin'