- Search Energy EXCH
- 32 Results
-
 lb575 replied Dec 2, 2018
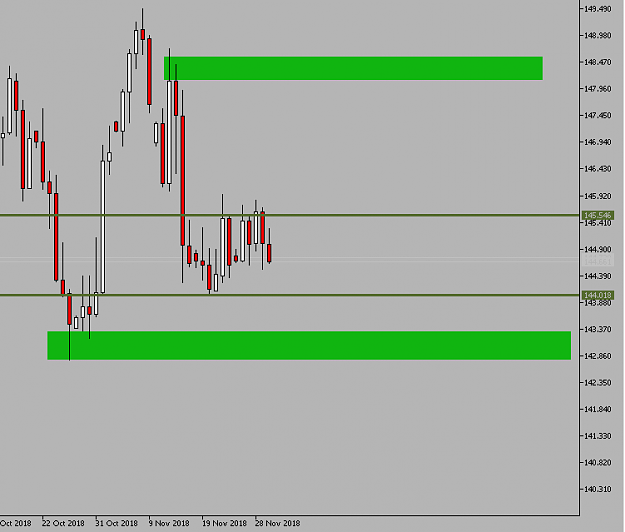
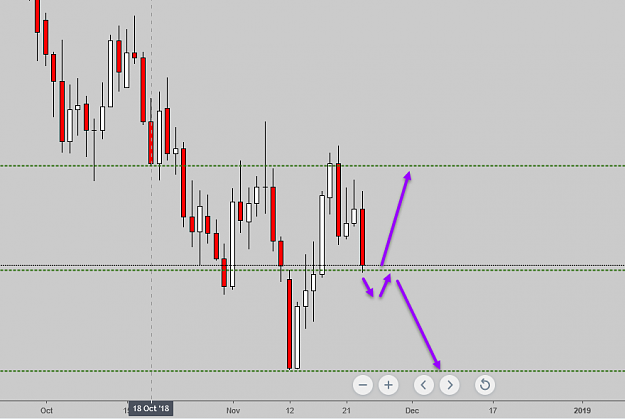
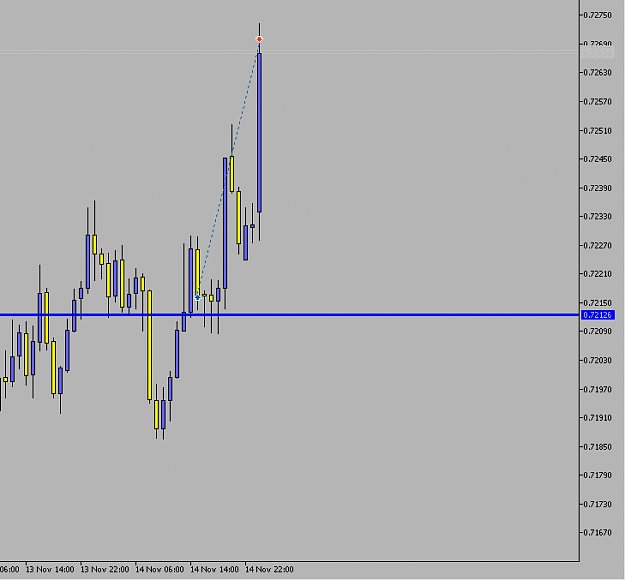
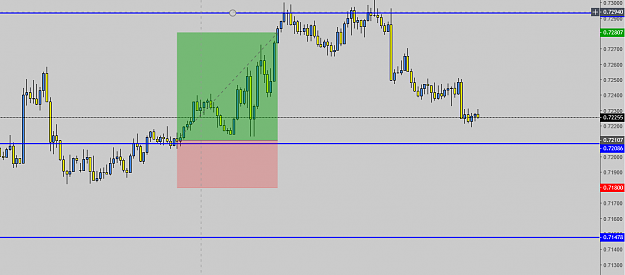
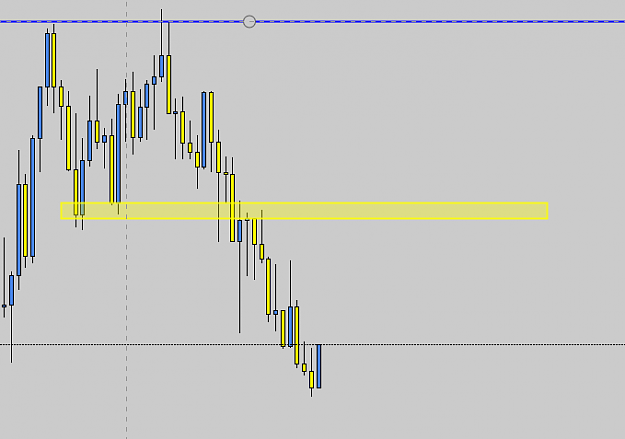
Waiting for GBPJPY to break out my targets are the green boxes
Support and resistance trading
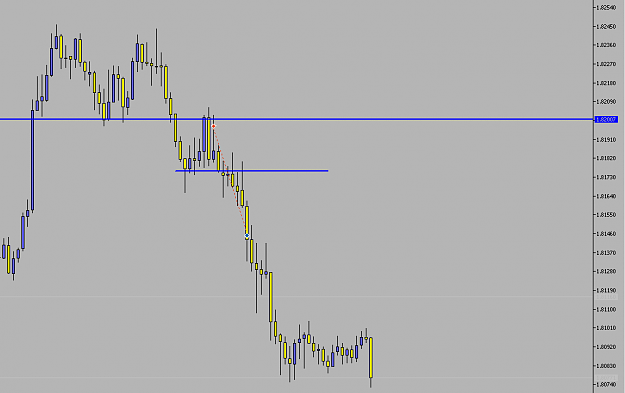
- lb575 replied Dec 1, 2018
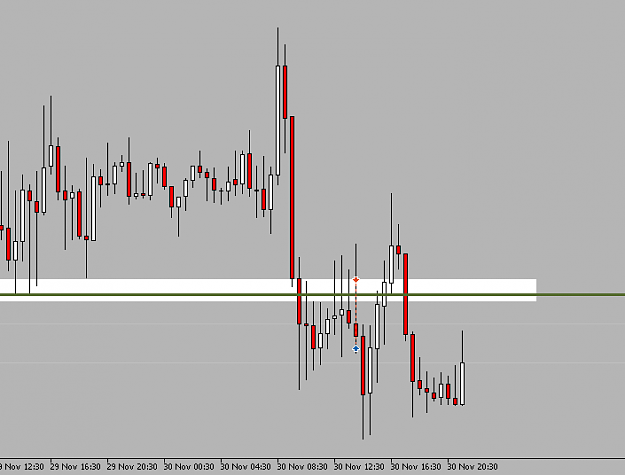
GBPUSD m30 chart. Price broke support and then retested it as resistance. look at all of those wicks that tried to break through but couldn't. that was a major clue that price would go down. The market structure was also bearish as well.
How to trade support and resistance
- lb575 replied Dec 1, 2018
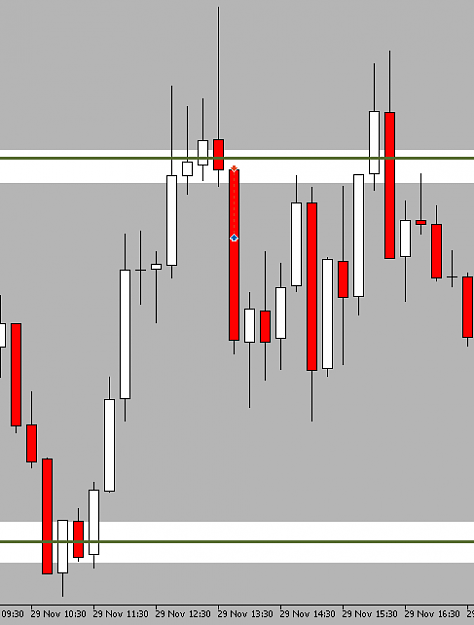
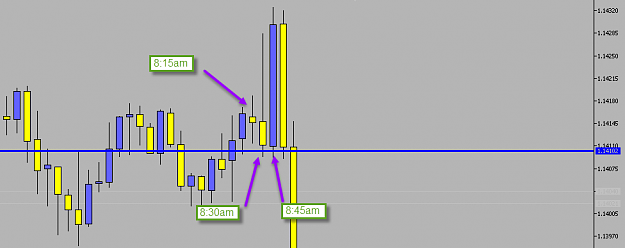
price rejected resistance at the 8:30am candle then pushed on the 8:45am candle. EURUSD m15 chart
EURUSD new york session cheat code
- lb575 replied Nov 25, 2018
this is what i am looking at for EURUSD on the daily time frame
How to trade support and resistance
- lb575 replied Nov 25, 2018
EURUSD on the daily time frame. I am personally looking for a move to the down side but we will see how that support holds
Support and resistance trading

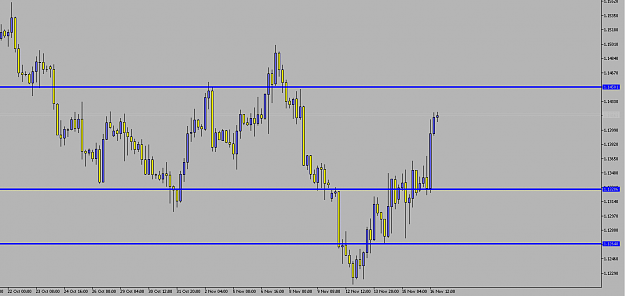
- lb575 replied Nov 17, 2018
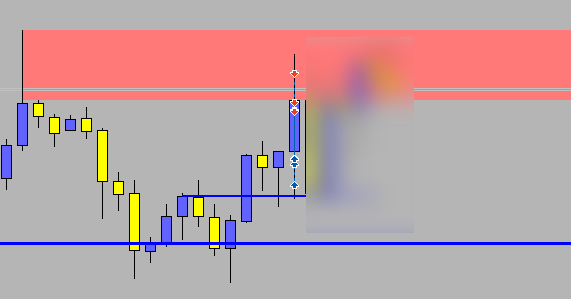
I personally think EURUSD will break resistance at 1.14500 this week. Given how the weekly closed and how the market structure is setting up.
Support and resistance trading
- lb575 replied Nov 17, 2018
market structure held on AUDUSD H1 chart. What i wrote in that blog happens every single week. You just have to learn how to spot them.
How to trade support and resistance
- lb575 replied Nov 15, 2018
AUDUSD H1 chart. overall market structure on the daily is bullish so i waited for confirms on the H4 chart. once the H4 candles showed promise to go up i entered on the H1 chart
Support and resistance trading
- lb575 replied Nov 13, 2018
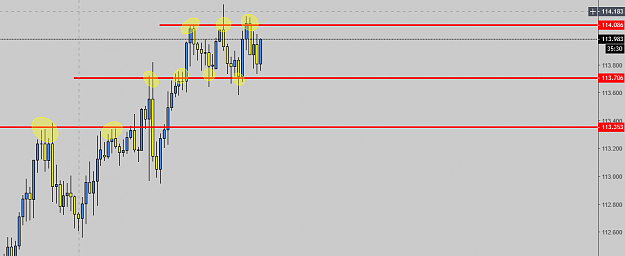
Just look for rejection areas on the H4 chart. This is USDJPY H4 chart the yellow circles are area of rejections so i would consider that support or resistance
Support and resistance trading
- lb575 replied Nov 13, 2018
This is my EURUSD M15 chart buy from this morning. Price broke through my resistance level so i took buys. I only aim to make 5-10 pips a day and easily go that with this one.
Support and resistance trading

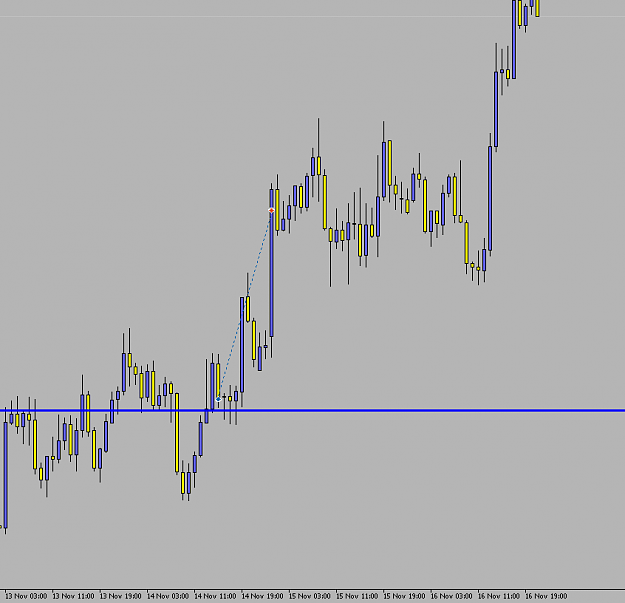
- lb575 replied Nov 10, 2018
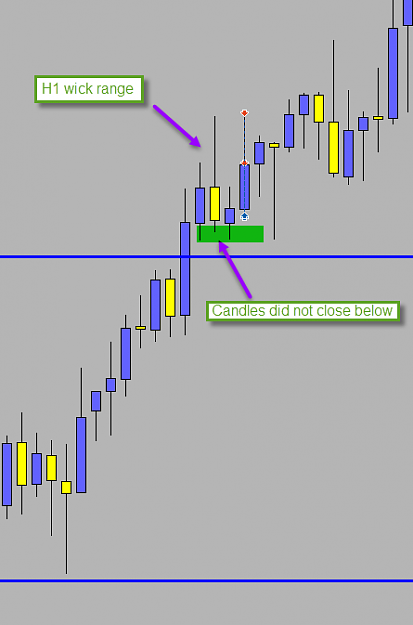
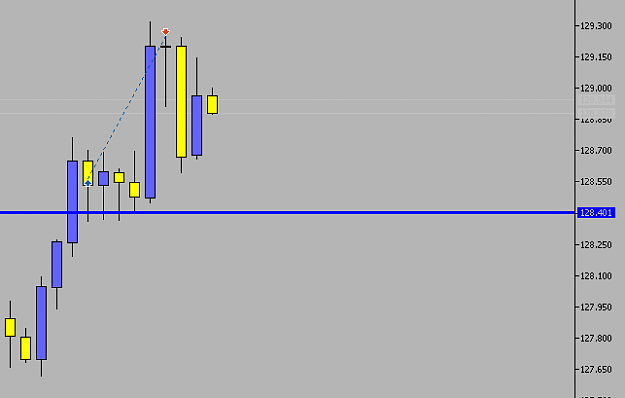
Notice how the market structure stayed the same as price broke through resistance, indicating that this level will be broken and will push higher.
How to trade support and resistance
- lb575 replied Nov 6, 2018
AUDUSD m15 chart. Resistance at 0.72400. the yellow box indicates where market structure changed from the major resistance.
How to trade support and resistance
- lb575 replied Nov 3, 2018
8:45am push happened this week perfectly.
EURUSD new york session cheat code

- lb575 replied Oct 31, 2018
double bottom at major support and market structure changed to bullish
How to trade support and resistance
- lb575 replied Oct 27, 2018
GBPAUD was at daily resistance and the overall trend was bearish. M15 market structure turned bearish at daily resistance then dropped 100 pips.
How to trade support and resistance
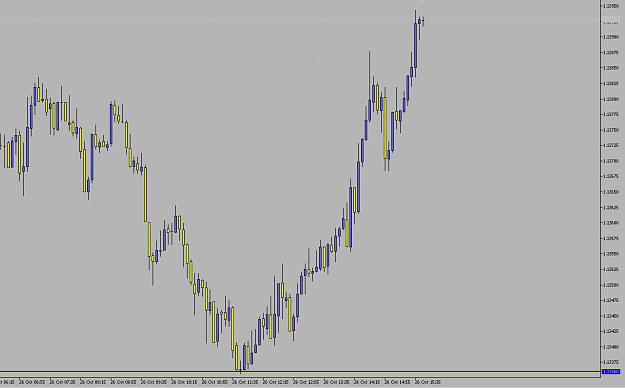
- lb575 replied Oct 26, 2018
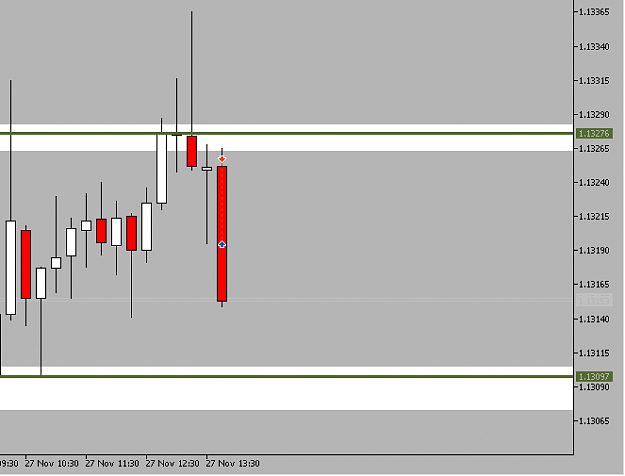
Trade from this morning. Daily support at 1.13360. Look at how the M5 market structure reacted to that level.
How to trade support and resistance