- Search Energy EXCH
- 116 Results
-
 lKeithStone replied Apr 30, 2017
Finally someone who gets it. Why would any retail trader want to trade a market that doesn't show true volume? Instant disadvantage.
5 years and still no strategy

- lKeithStone replied Apr 19, 2017
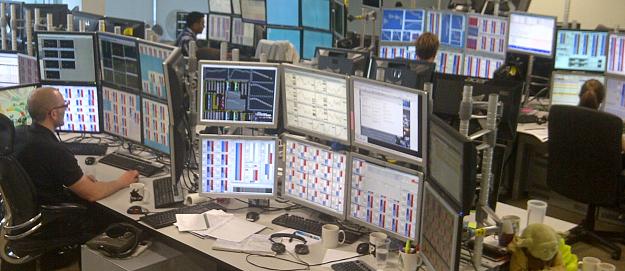
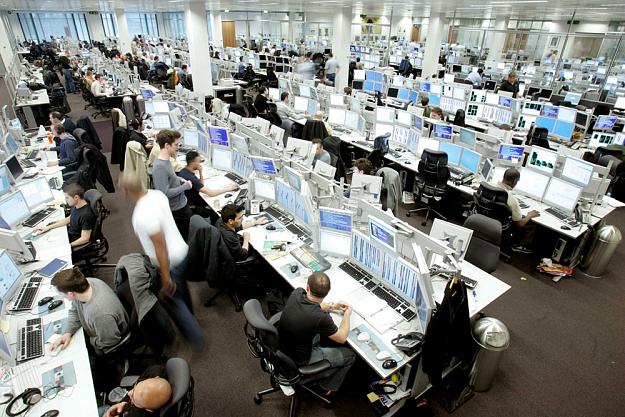
These guys are not looking at DOM's to get into swing trades. They are pushing size and scalping ticks or spreading. I'm 99% sure they are not trading Spot Forex since there is no depth of market. Here is another trading floor. You can google image ...
5 years and still no strategy
- lKeithStone replied Apr 19, 2017
Hmmm a bunch of professional traders... Where are all the charts loaded with indicators? Weird... I do see several of them have DOM's on their screens though. I wonder if those are important? Nah I would much rather follow someone on FF. lol
5 years and still no strategy
- lKeithStone replied Apr 18, 2017
React to what is happening now. Anyone can identify S/R, Trend lines, Moving Average bounce, ect... But these alone are not an edge, they are reference points. Being able to see participation at these reference points can provide the edge. You want ...
5 years and still no strategy
- lKeithStone replied Jan 31, 2017
EU = Wowza. Some big boys getting involved here (either selling to go lower or getting out of longs)... 300 contracts in one order (That's $3,750 per tick). I went short. Let's see if I get ran over.
Trader Dale - daily trading levels small risk.
- lKeithStone replied Jan 27, 2017
Hi Radaway, A - Yes, that indicator comes with Sierra Charts level 5 package. Infinity Futures only provides the level 5 package. So if you do what I explained above, you won't have to pay extra for the level 5 package. Below is an animated image on ...
Trader Dale - daily trading levels
- lKeithStone replied Jan 27, 2017
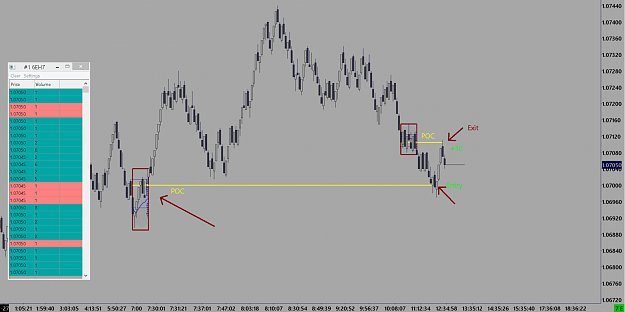
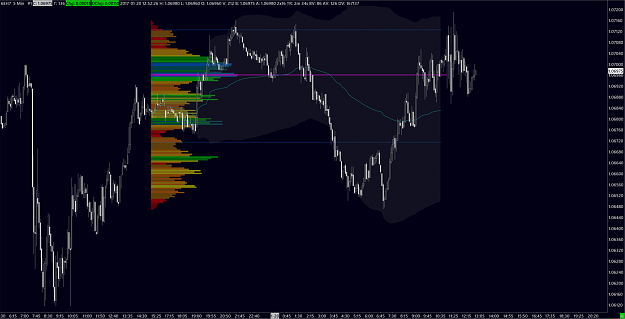
Here is a great example of a trade I just took by drawing VP around consolidation areas/start of move (+10). Notice how this is the first test of that POC... the first pullback missed it. The blue candles in my previous pics represent contracts ...
Trader Dale - daily trading levels
- lKeithStone replied Jan 27, 2017
Drawing custom VP around short term consolidation areas is a great way to find scalps or add to positions. Notice how price retraces back to value (yellow POC). Click the image to see the animation.
Trader Dale - daily trading levels
- lKeithStone replied Jan 27, 2017
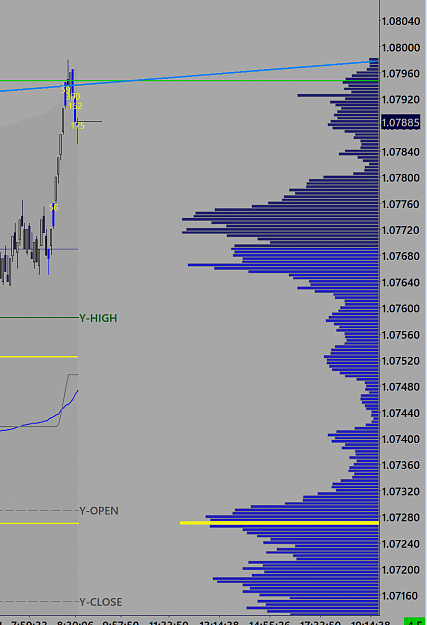
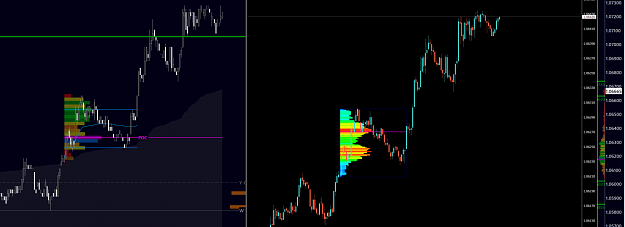
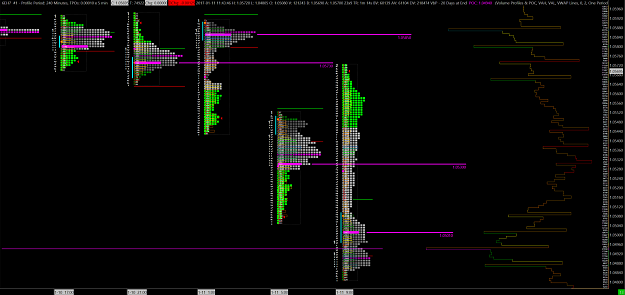
Hey Ziggy! If you want to see if TradingView's Profile is pulling futures data I'm attaching a chart of todays volume profile for 6E. I'm curious to see if it is?
Trader Dale - daily trading levels
- lKeithStone replied Jan 20, 2017
Here is the 6E volume you requested. I tried to align the VP tool to the same area you have yours plotted. But as Ziggy was saying Forex tick data will never be capable of showing actual volume at price no matter how you try to adjust it.
Trader Dale - daily trading levels
- lKeithStone replied Jan 17, 2017
EU - Some large contracts firing off in this area after that strong move up. Decision point at these levels. No trade for me yet. Bulls are strong!
Trader Dale - daily trading levels
- lKeithStone replied Jan 17, 2017
What a great Profiling tool for MT4, akift. One of the better indicators I've seen. Good job. I would like to warn people though... using tick data to find levels will not be as accurate as true futures volume - so you may need to widen your stop. ...
Trader Dale - daily trading levels
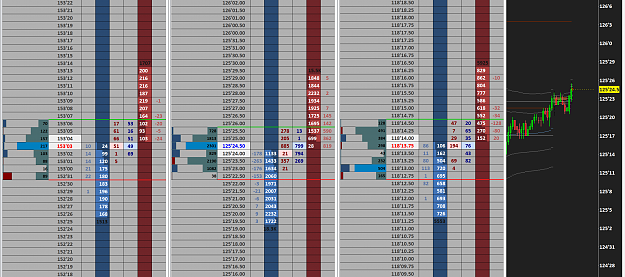
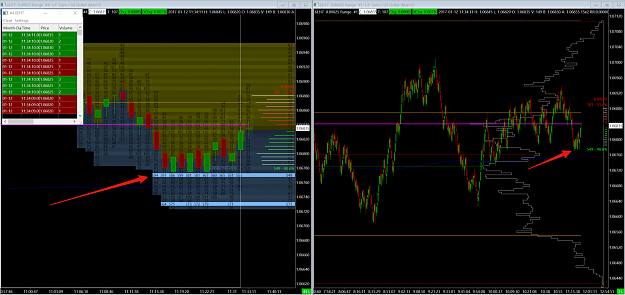
- lKeithStone replied Jan 12, 2017
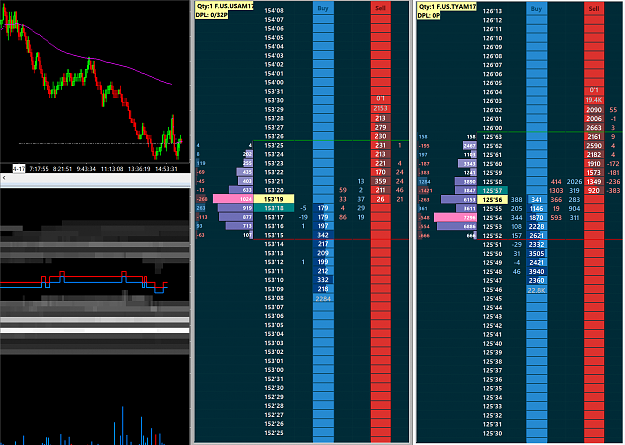
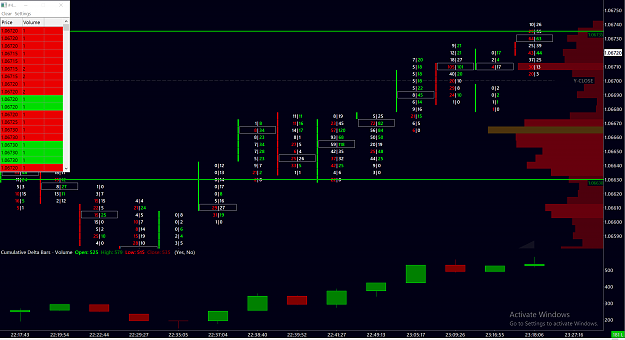
Big order blocks. After watching the Market depth tool throughout the day the accuracy is pretty incredible. Combine that with Time and Sales + Profile levels + Experience, and I have found my X Factor. Good day!
Trader Dale - daily trading levels
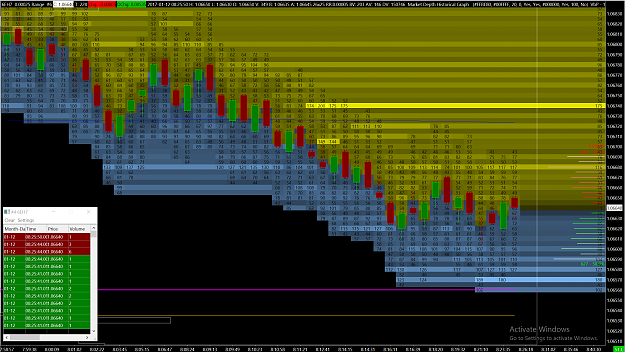
- lKeithStone replied Jan 12, 2017
To those of you using Sierra Chart I've been using a pretty cool tool this morning that shows depth of market in a graph format (similar to Bookmap). I recommend throwing it on a separate chart and zooming in. It's called "Market Depth Historical ...
Trader Dale - daily trading levels
- lKeithStone replied Jan 11, 2017
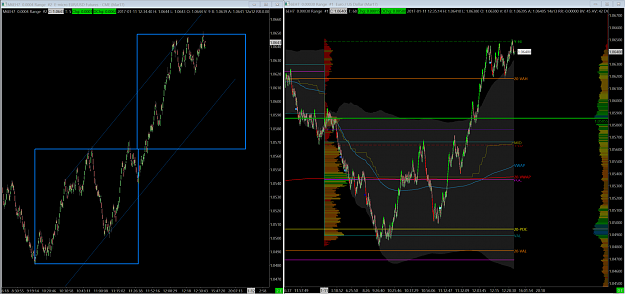
Wow. Crazy volatility today. This is why I never trade the news. Another chart...
Trader Dale - daily trading levels
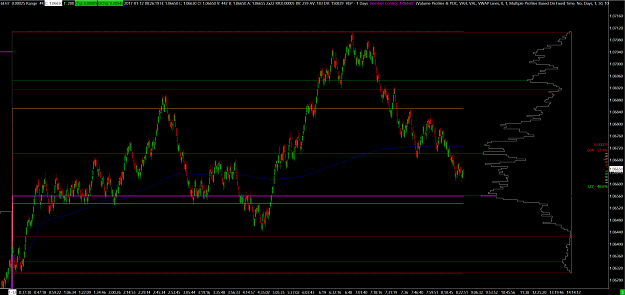
- lKeithStone replied Jan 11, 2017
High volume areas. 1.0558 - Forex level
Trader Dale - daily trading levels
- lKeithStone replied Jan 11, 2017
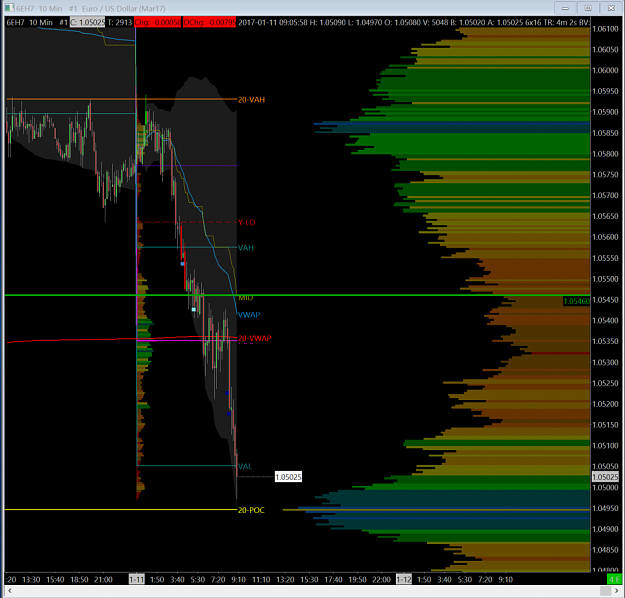
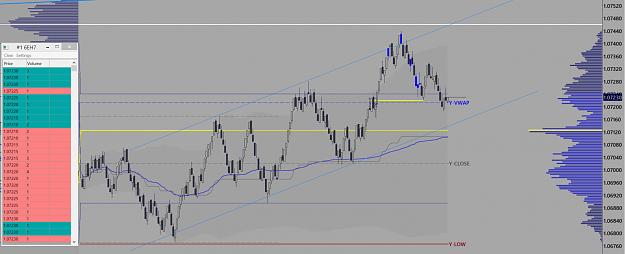
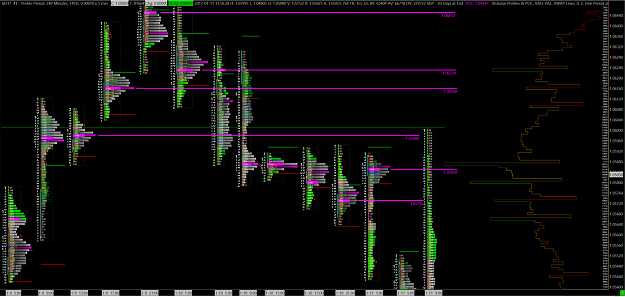
Futures levels (yellow) I'm interested in.
Trader Dale - daily trading levels
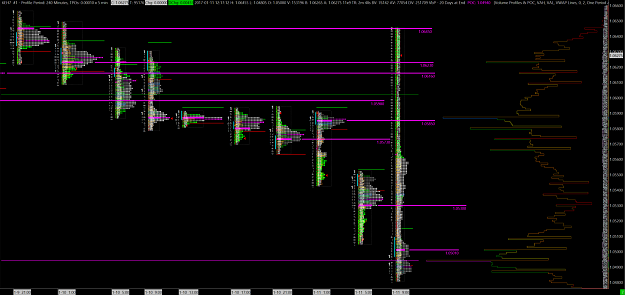
- lKeithStone replied Jan 11, 2017
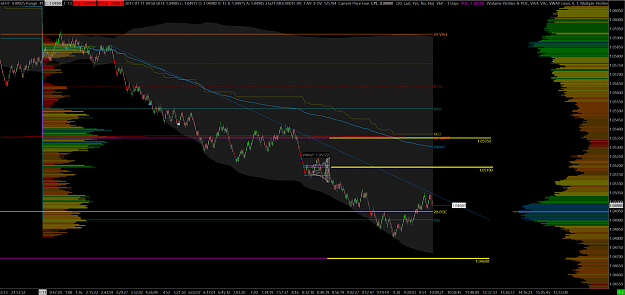
1.04945 is EU's 20 day POC... watch for a bounce. Sorry... I'm looking at futures so the price is probably different for FX.
Trader Dale - daily trading levels