- Search Energy EXCH
- 48 Results
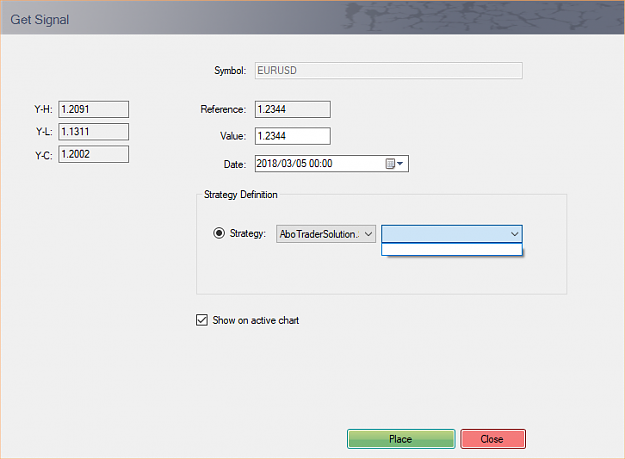
- krishelis replied Mar 19, 2018
Hi Bobi, Is this just me or other as well have the same problem? I can not apply any strategy: image
ABDTrader(Abonacci Dynamic Trader)

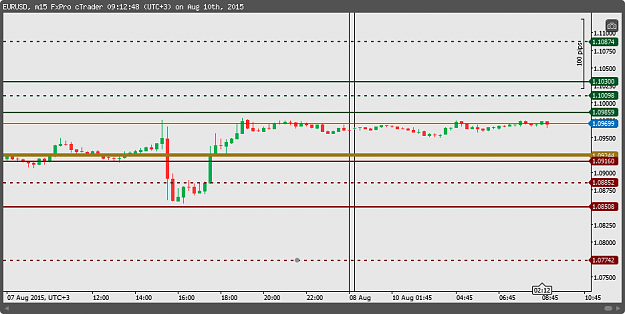
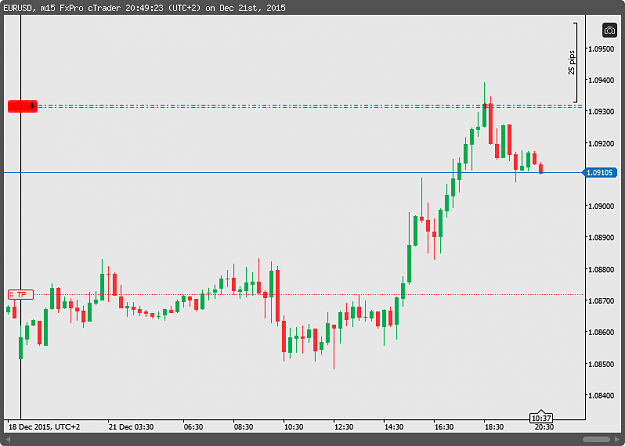
- krishelis replied Dec 21, 2015
Nice, Small short from 1.0931 till 1.0872, but still targeting long till at least 1.1017
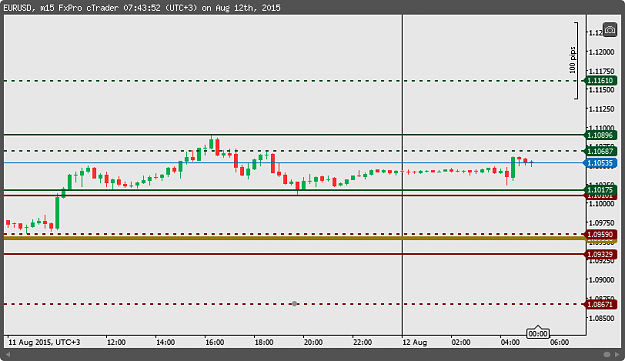
EURUSD
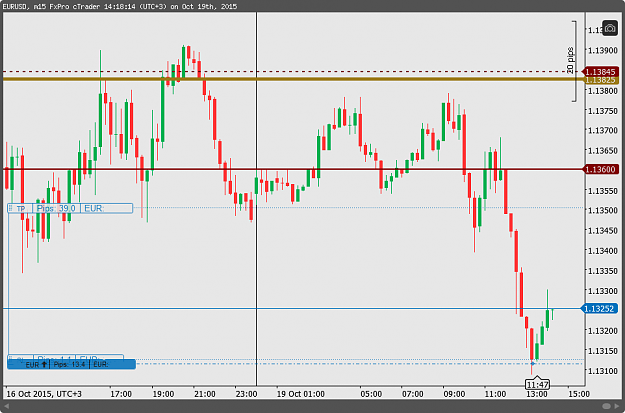
- krishelis replied Oct 19, 2015
Targeting 1.1352 If won't reach, will buy lower and targeting 1.1352 again
EURUSD
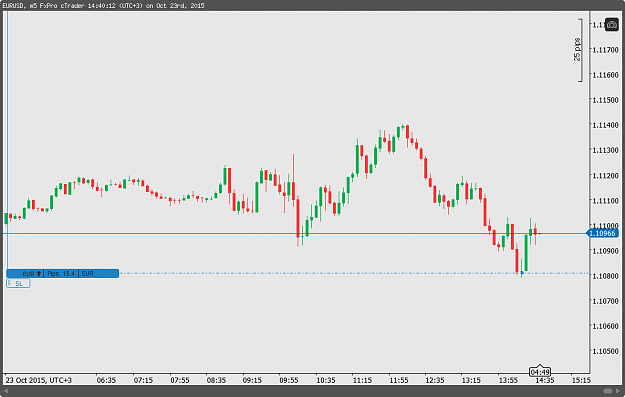
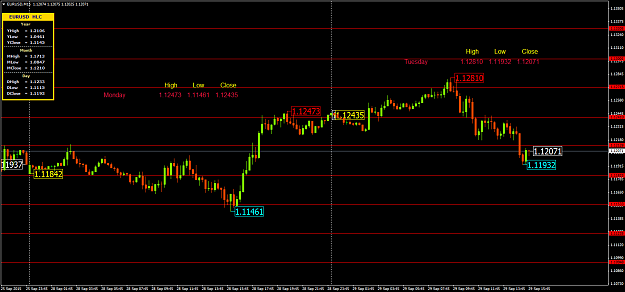
- krishelis replied Sep 29, 2015
1.1182/1.1153 I'm wondering if you have the same function?
EURUSD And all lines are drawn at the beginning of the month.
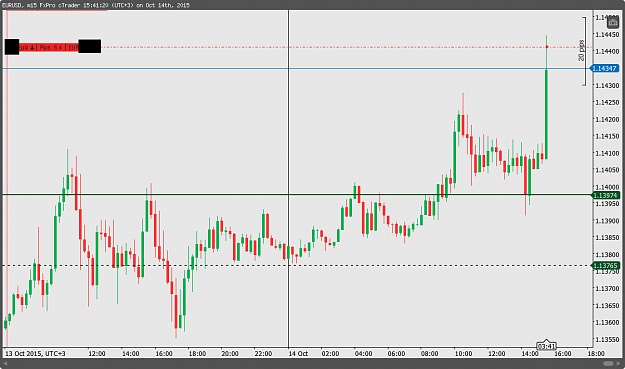
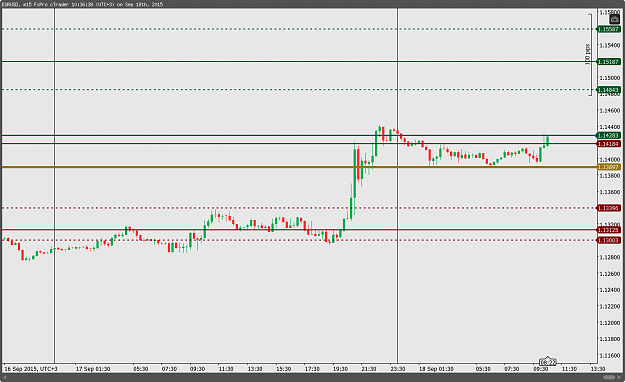
- krishelis replied Sep 18, 2015
I agree. But I follow my system, but it doesn't mean that I'm going to buy immediately after a breakout. Today's levels and TP:
EURUSD
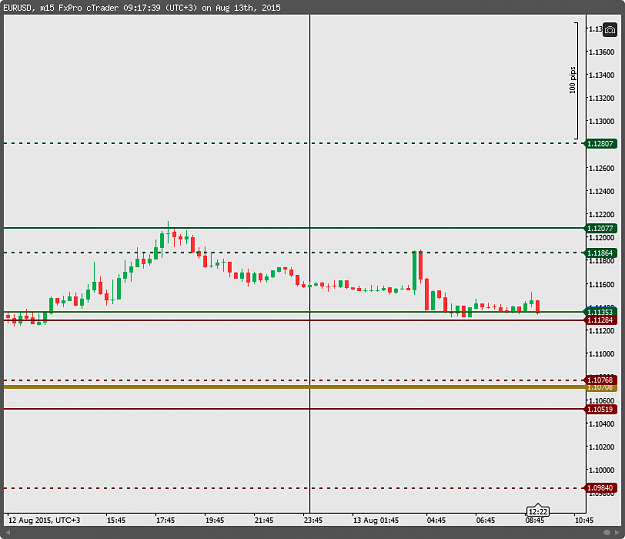
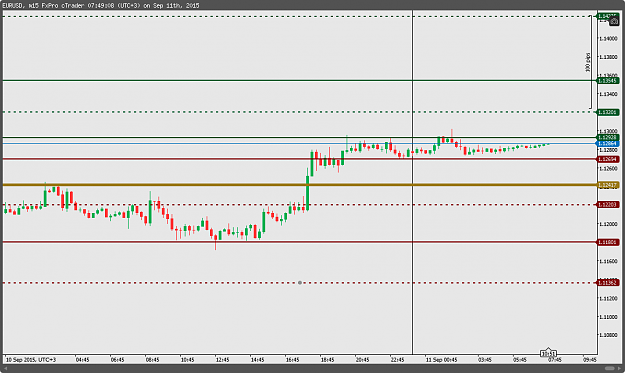
- krishelis replied Sep 11, 2015
I am, but underwater, 1.1260. That was risky trade for me, not followed by rules, but after break of 1.1293 I am looking to go long.
EURUSD
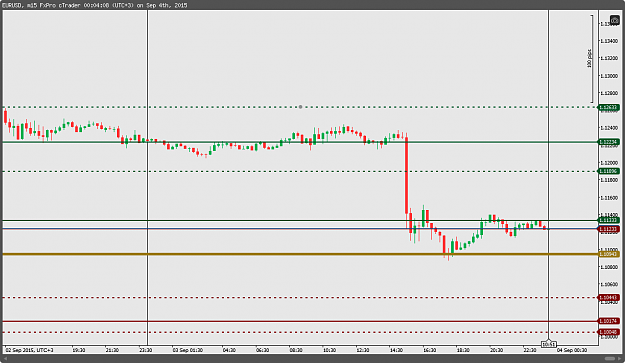
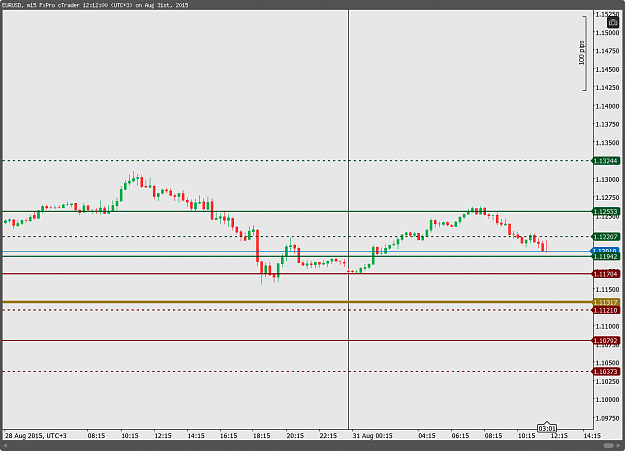
- krishelis replied Sep 3, 2015
I will wait for sell, wouldn't buy even if it will break buy level.
EURUSD
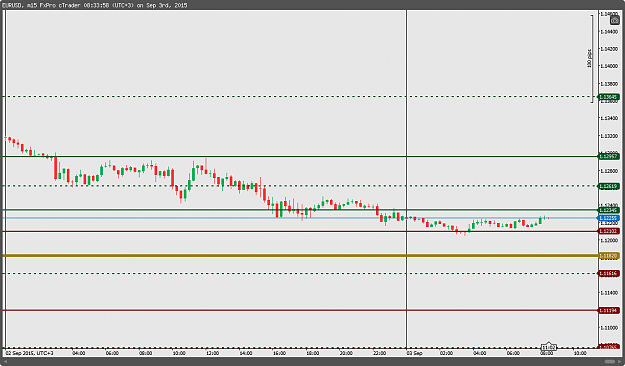
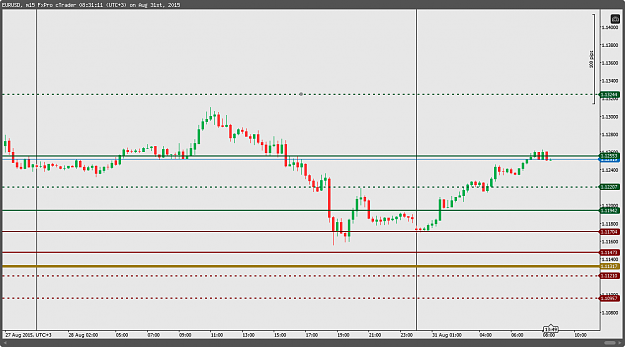
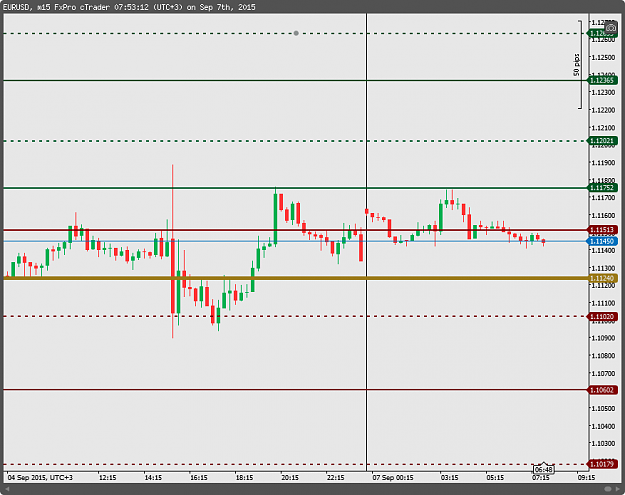
- krishelis replied Sep 2, 2015
Price broke yellow trend line, so it is very good sign for bears. 1.1258 will be confirmation for moving down.
EURUSD
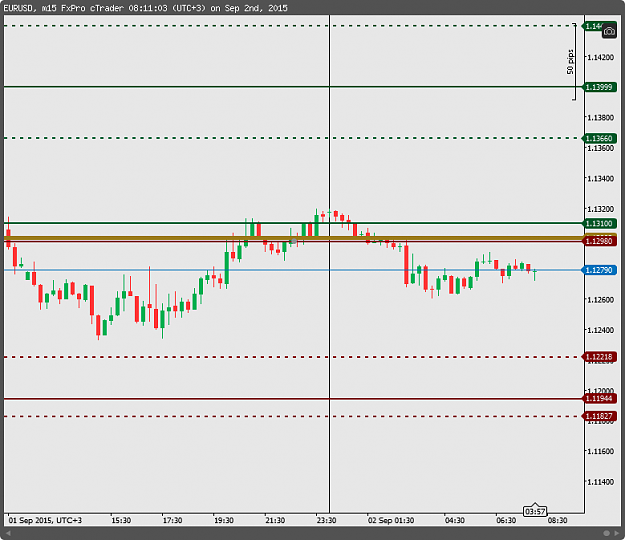
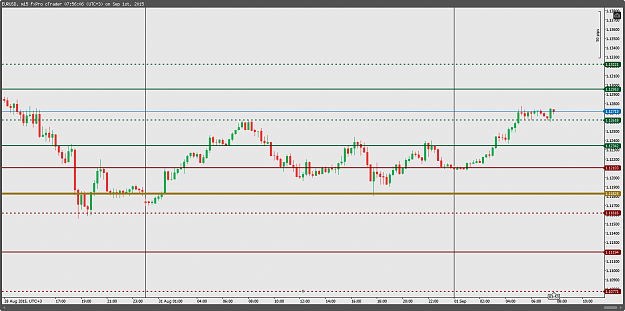
- krishelis replied Sep 1, 2015
1.1300 is going to be hard point to break. For new ones: Yellow line is trend line = if NY close price is above, it means bullish, below - bearish. Breaking means, changing trend. Green line = break of green line by 10 pips = buy signal triggered. ...
EURUSD