- Search Energy EXCH
- 17 Results
-
 juantrader replied Jul 21, 2019
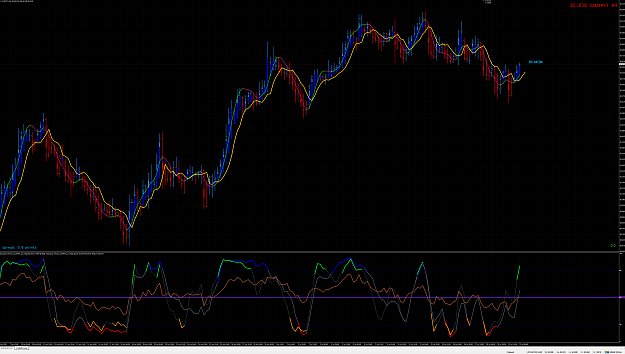
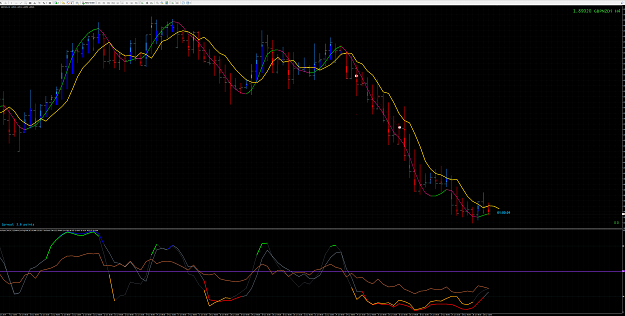
CADJPY H4 in this moment, good setup soon, I will check on M1 and M5, the price broke an H4 Resistance..... Let's see....Good week to everyone....
Trading Made Simple(r)
- juantrader replied Jun 29, 2019
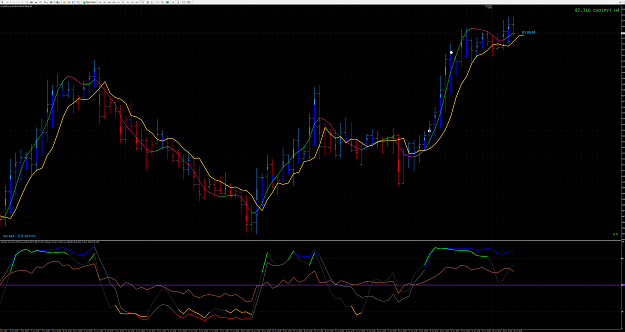
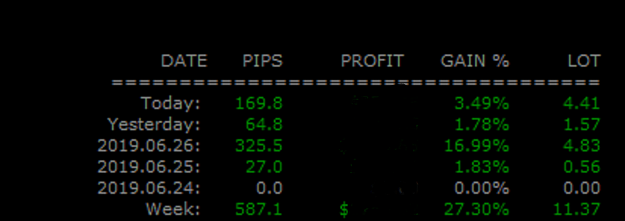
My results this week and some of the trades taken, now we need to implement multiple entries to optimize and manage the profits better. Many thanks to Mr. RH for his great method, his explanations and his nobility in sharing it
Trading Made Simple(r)
- juantrader replied Jun 25, 2019
Thank you Giedrius.... I took GBPUSD too, but was a H1/M15 trade, right now is good moment to take in H4
Trading Made Simple(r)
- juantrader replied Jun 23, 2019
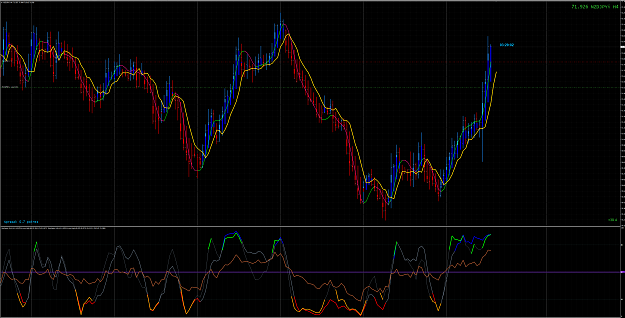
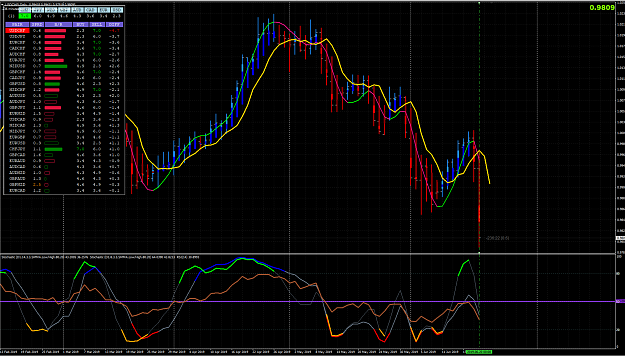
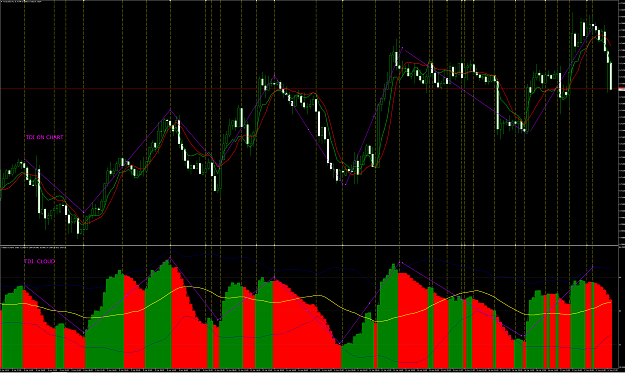
I show you an example with the EURJPY H4 pair, applying the HR template and an additional indicator, the TMS matrix, which indicates the trend in 4 different times frames. In the graph, at the top right I place the references to the numbers that ...
Trading Made Simple(r)
- juantrader replied Jun 22, 2019
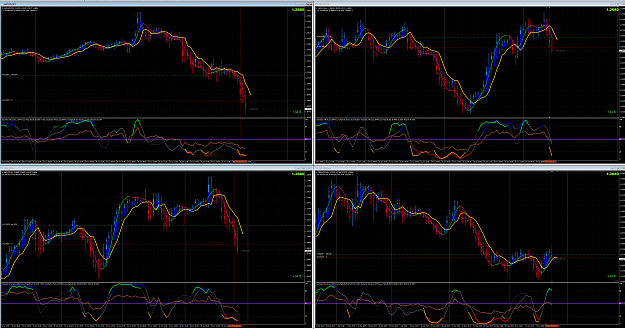
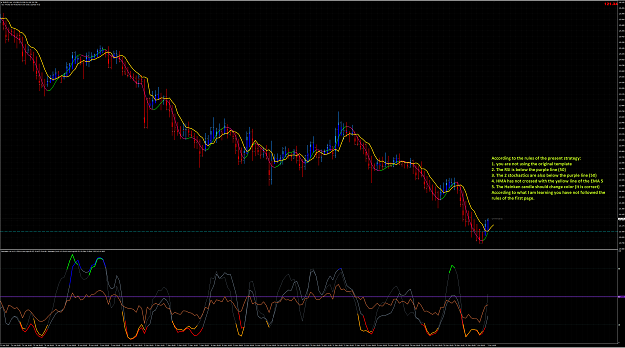
In my opinion all the entries are late, I put in the graph the possibles entries points , however I think that you could also enter in the next candle after the entries points marked in the picture too. If RobinHood could correct us, it would be ...
Trading Made Simple(r)
- juantrader replied Jun 20, 2019
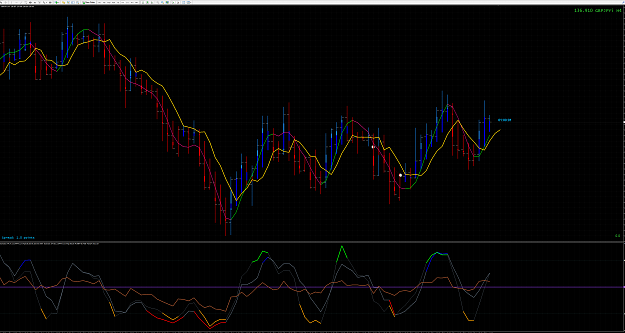
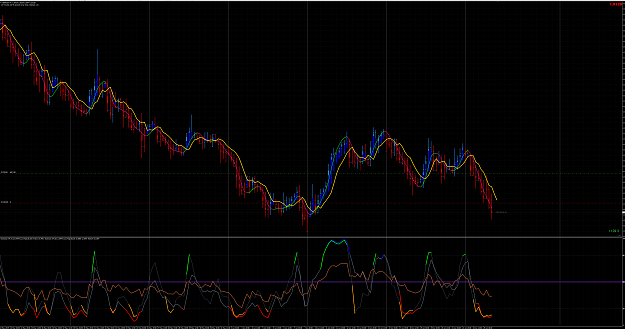
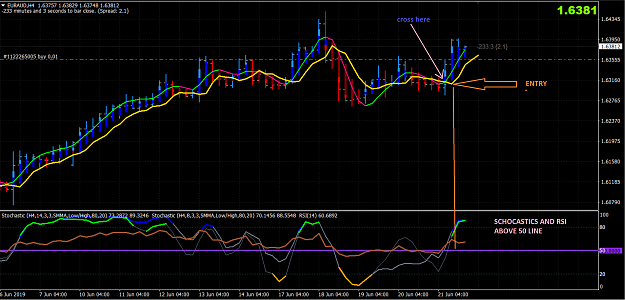
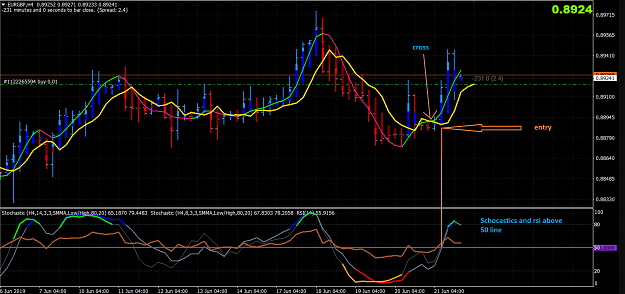
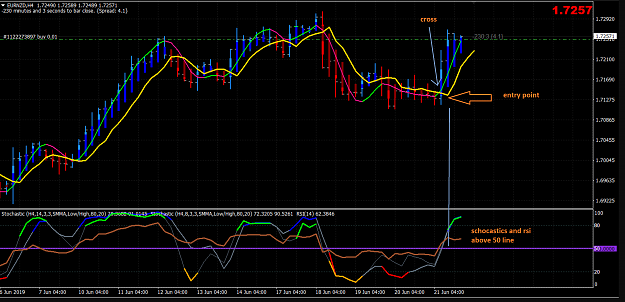
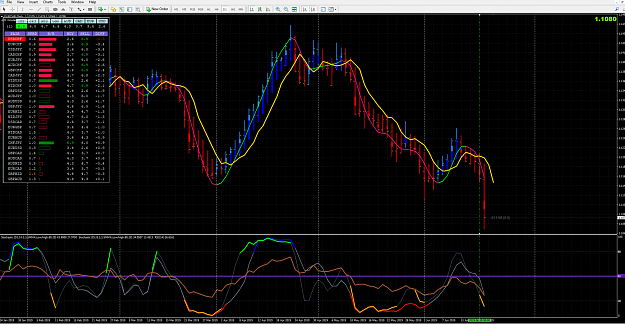
Example where the pair GBPJPY is about to cross the purple 50 line to be able to place a short order in H4, although in the Daily, the color of the candles are in blue yet. The trend is clearly bearish, and the dash also promotes short. RobinHood ...
Trading Made Simple(r)
- juantrader replied Jun 20, 2019
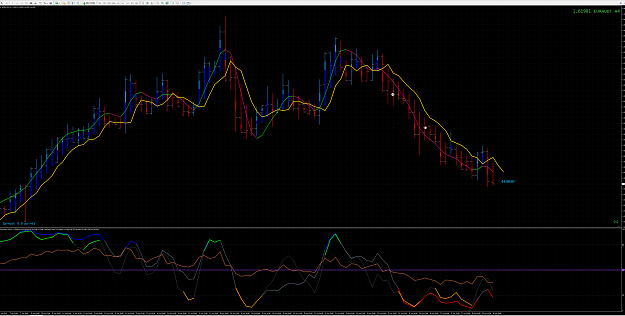
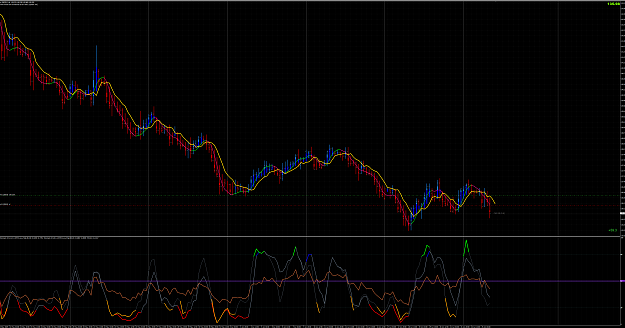
Here, example of the USD/CHF pair in daily with the Csdash and Robinhood template
Trading Made Simple(r)
- juantrader replied Jun 20, 2019
Thank you, I have it, but you must be very careful when using it.
Trading Made Simple(r)
- juantrader replied Jun 12, 2019
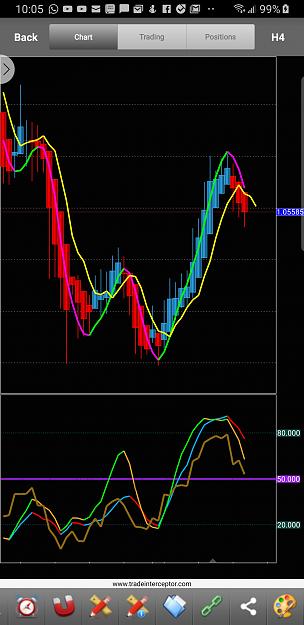
I tried to adapt a similar templade that RH but for the phone with the trade interceptor application, the differences are: 1. Only Heiken Ashi Candles can be used (no sinergy) 2. Stochastics do not show the overbought or oversell areas but changes ...
Trading Made Simple(r)
- juantrader replied Jun 8, 2019
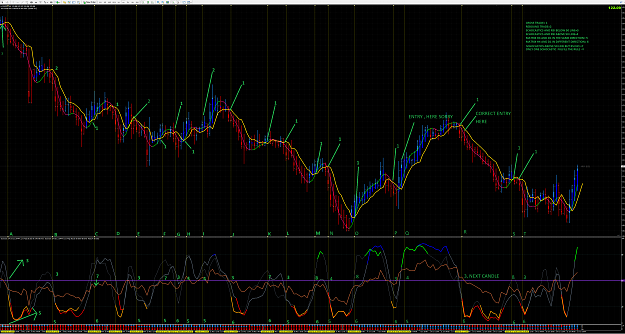
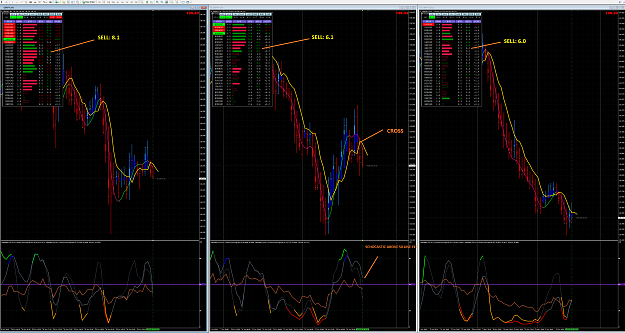
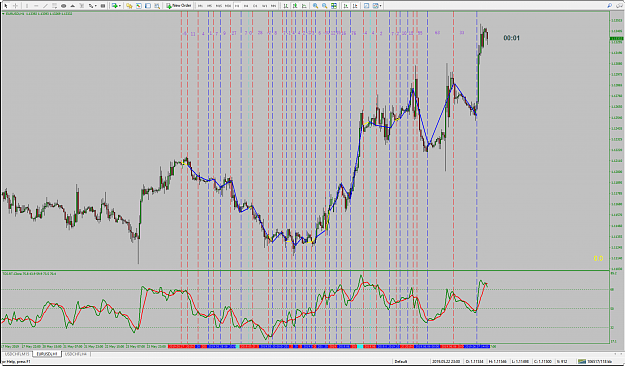
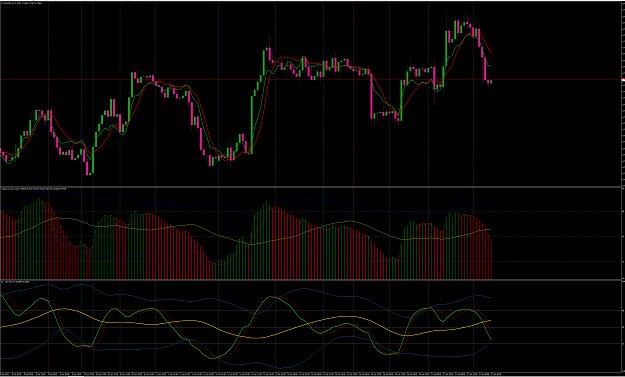
Good day to all, basically I have done the same work of Tekkies, looking with the vertical lines of the TDI crosses, I have found 19 crosses with bearish tendency, 16 bullish and 2 that I could not determine, for a total of 37. It is probable that ...
Trading Made Simple
- juantrader replied Jun 3, 2019
"Hello, Just wanted to share a trade i took on EURJPY H4. I know it is counter trend, but a retracement was long overdue i believe. Lookinnlg forward to any feedback. After 20 pips in profit i moved SL to BE. Green pips, Bill" Please check the graph ...
Trading Made Simple(r)
- juantrader replied May 29, 2019
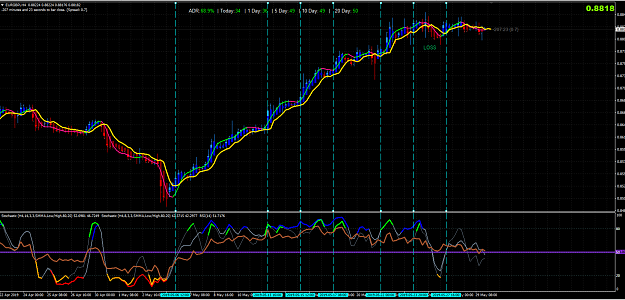
Dear Robin Hood, please, may you check if the vertical blue lines indicate possibles re-entries according to your method?
Trading Made Simple(r)
- juantrader replied May 17, 2019
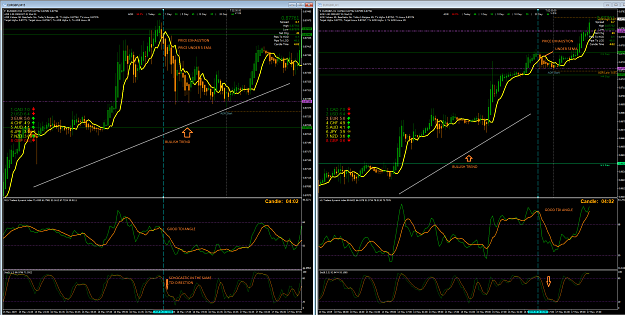
Dear Tekkies and the rest of the forum, I hope all us you are very well and preparing for the weekend. I would like you to advise me in a situation like the one presented in the following graph: a good setup is shown for a short in the EUR / GBP ...
Trading Made Simple
- juantrader replied Apr 17, 2019
Hello Tekkies, thank you very much for your example, I really was referring, if you could take the operations in M5 taking as H1 as superior TF, I believe that Mr. RickM does it, anyway you have been doing it for a long time with M15 and It goes ...
Trading Made Simple
- Posts by Member Search: 'juantrader'