- Search Energy EXCH
- 18 Results
-
 jonjon0711 replied Apr 13, 2024
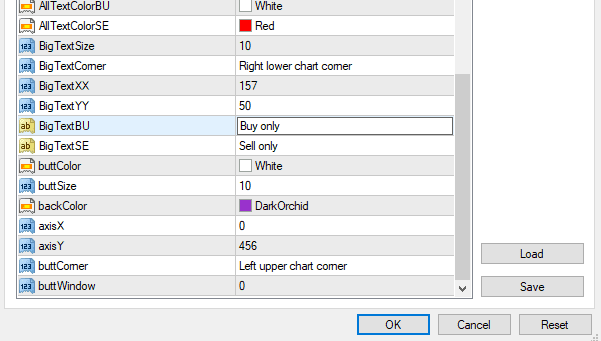
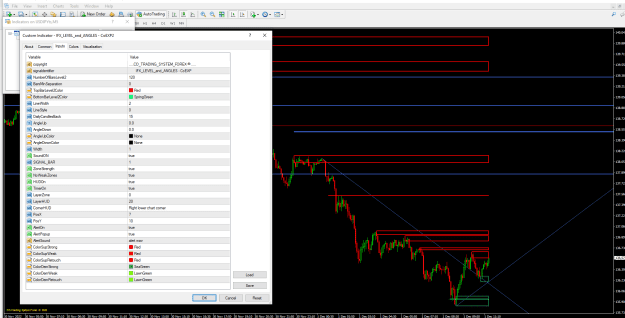
Hi Jeanlouie, Thanks for the response. Unfortunately i need it like the image i've shared please, at the right lower chart corner in the subwindow. image
I will code your EAs and Indicators for no charge
- jonjon0711 replied Feb 27, 2024
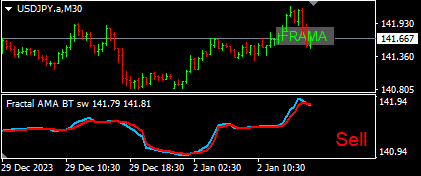
Hello Kvak, if possible can you make the fractal AMA histo like this in the picture please? file image Kind Regards, Jon
MTF Dashboard thread
- jonjon0711 replied Jan 1, 2024
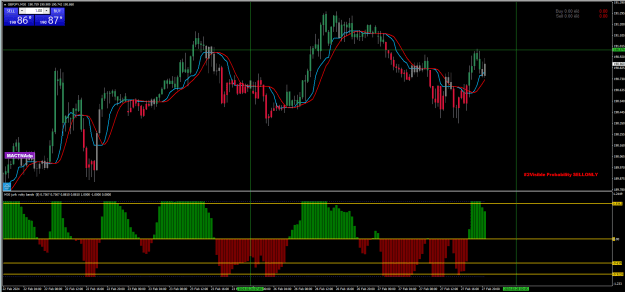
Greetings Jeanlouie, please, if possible, can you add a text header to this indicator in the sub window? I need it to display customizable buy and sell text like the Png image attached to this post. When the blue line is closed below the red line a ...
I will code your EAs and Indicators for no charge
- jonjon0711 replied Dec 31, 2023
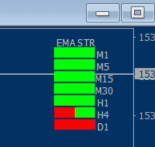
Greetings Kvak, Happy holidays to all!!! Please when you have time can you create a MTF dashboard for this indicator? When the Blue line is closed above the Red line the timeframe on the dashboard turns Green and when the Blue line is closed below ...
MTF Dashboard thread
- jonjon0711 replied Jun 12, 2023
Hi Jblanked, if possible can you please add candle high and candle low markers:dashes to only the first candles that close above and below the middle trend? below i attached an image to give you an idea of what i mean but i dont need the close lines ...
I will code your EAs and Indicators for no charge
- jonjon0711 replied Mar 1, 2023
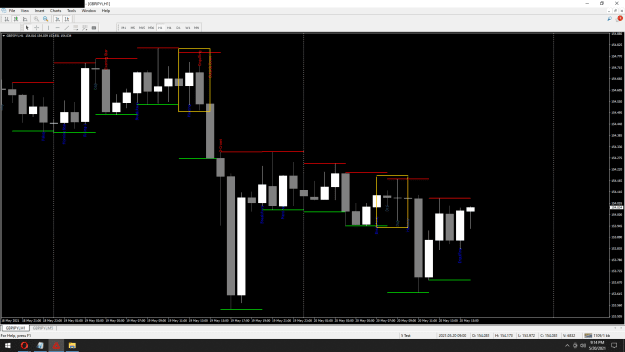
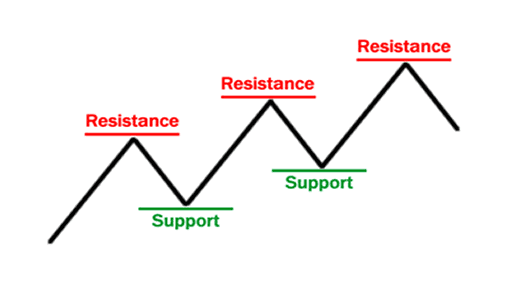
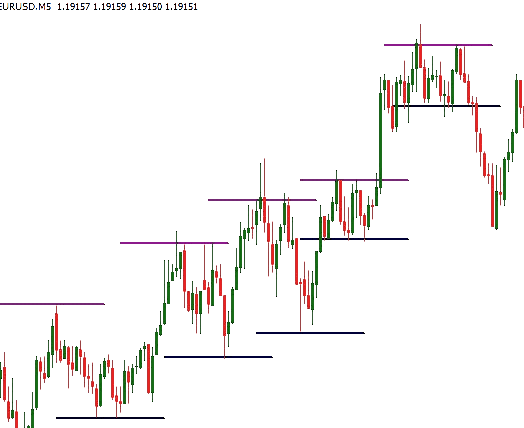
Hi Jeanlouie, would it be possible possible if you could add horizontal support and resistance lines like the image below please?
I will code your EAs and Indicators for no charge
- jonjon0711 replied Feb 14, 2023
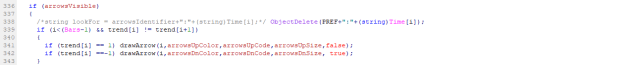
Good day everyone, Can someone please share some code on getting arrows in this code to display text instead of arrows? Would be greatly appreciated!
I will code your EAs and Indicators for no charge
- jonjon0711 replied Dec 21, 2022
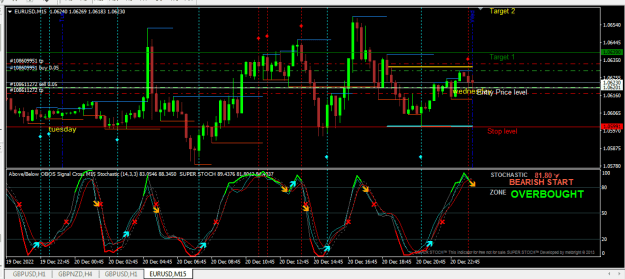
Hi can you share the indicator that displays the current conditions of the stochastics please? image
I will code your EAs and Indicators for no charge
- jonjon0711 replied Dec 11, 2022
Good day Cja, can you please modify or update this interesting indicator you've authored so that it shows when attached to the chart i got it to work on one chart but it didn't work on any other chart.. Please when you have the time this indicator ...
Monthly/Weekly Open Line
- jonjon0711 replied Dec 1, 2022
Hello Comar.Fx, this is a fantastic indicator but i was wondering if you can maybe modify it to change the level colors that are blue please Kind Regards, Jon image
Up and under price pattern
- jonjon0711 replied Oct 28, 2022
Greetings dear coders can someone please add LL HH HL HL to this indicator in the subwindow please? image n ZigZag_HH-HL-LH-LL_B BT.mq4
I will code your EAs and Indicators for no charge
- jonjon0711 replied Sep 26, 2022
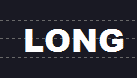
Hi, can any coder help me with this indicator var_mov_avg.mq4. I need it to display Buy and sell sides according to the dots For every buy dot, I would like for it to show its value on any corner of the chart (instead of it displaying long i would ...
I will code your EAs and Indicators for no charge

- jonjon0711 replied Sep 21, 2022
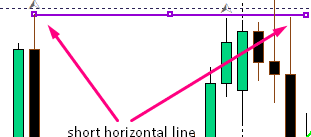
Indicator Bank it’s my fault for not properly explaining what I mean, retracted lines like this or shorter length horizontal lines image I believe these are support and resistance lines so again I do apologize for that; the modification is superb ...
- jonjon0711 replied Sep 20, 2022
Hey, is it possible to add retractable horizontal lines to this indicator please? like this image
Indicator Bank
- jonjon0711 replied Aug 24, 2022
image like this.. Hello tankk, can you add stoch value to this indicator please?
I will code your EAs and Indicators for no charge
- jonjon0711 replied Aug 11, 2022
Gratitude! One last request because i am not sure when i will get any more help with a request... can you please add a Rsi label code to the RSi that would display the value of the Rsi on this indicator file P.s. Like this but on the indicator ...
I will code your EAs and Indicators for no charge
- jonjon0711 replied Aug 11, 2022
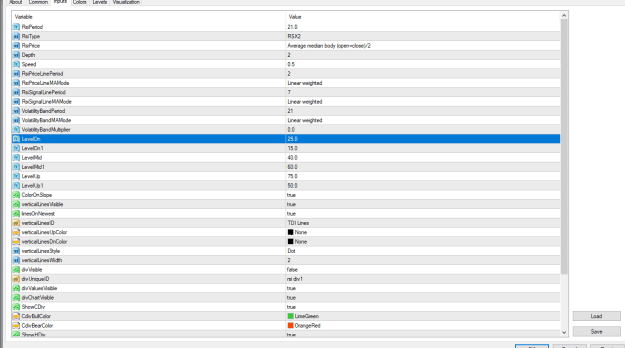
Yes respective Bluerain, i mean levels so i can add my own levels.. like this LevelDn LevelDn1 LevelMid LevelMid1 LevelUp LevelUp1 image
I will code your EAs and Indicators for no charge
- Posts by Member Search: 'jonjon0711'