- Search Energy EXCH
- 265 Results
- jackeollio replied Jun 18, 2021
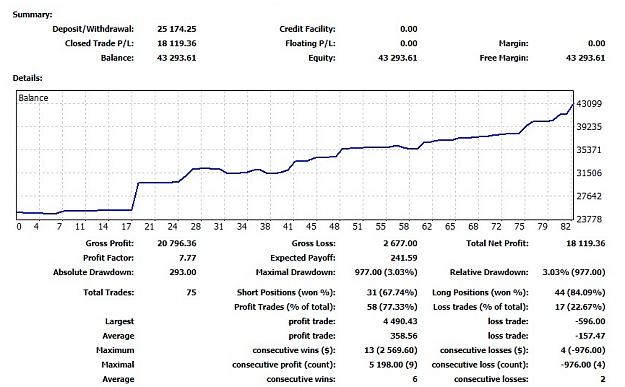
The chart below shows the profit realized over a period of a little less than 3 months with a starting balance of 25000$ on March 26th, 2021. Notice that the average number of trades per day required to acheive the total profit of 18119$ is less ...
Ollio's Gold - Supply and Demand


- jackeollio replied Jun 9, 2017
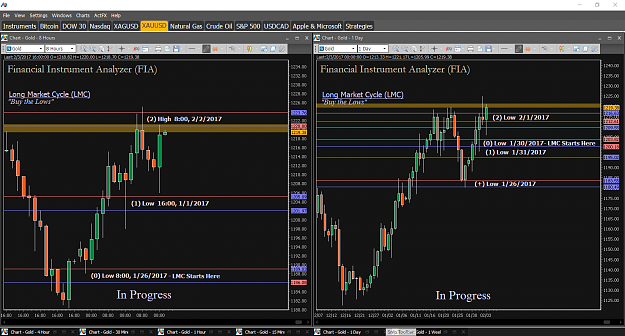
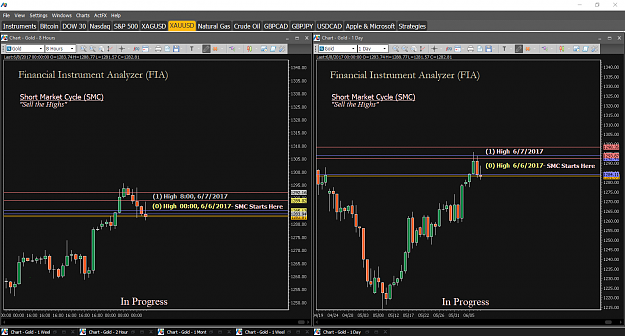
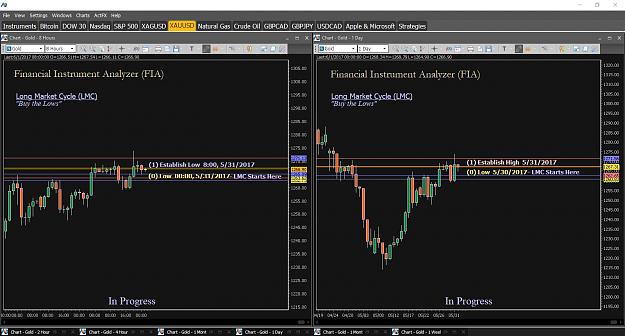
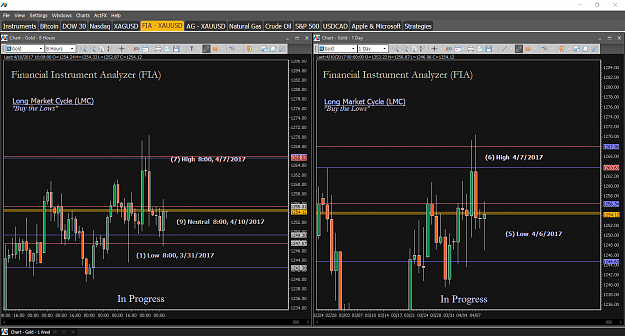
Trading market cycles using the FIA. The charts below illustrate the FIA's ability to easily identify changes in market cycles on the 8 Hour and Day timeframes. The first set of charts is a snapshot dated 06/01/2017 which shows the end of a Short ...
Ollio's Gold - Supply and Demand

- jackeollio replied Jun 2, 2017
Below are the FIA charts for the 8 Hour and Day timeframes dated 06/01/2017.
Ollio's Gold - Supply and Demand
- jackeollio replied May 24, 2017
Hi FxHarvester, The chart below illustrates the 3 main points I made in my previous post ... (1) poorly designed Supply & Demand analysis method, (2) incorrect Supply & Demand zones, (3) premature exit. Poorly designed Supply & Demand methods ...
Ollio's Gold - Supply and Demand
- jackeollio replied May 3, 2017
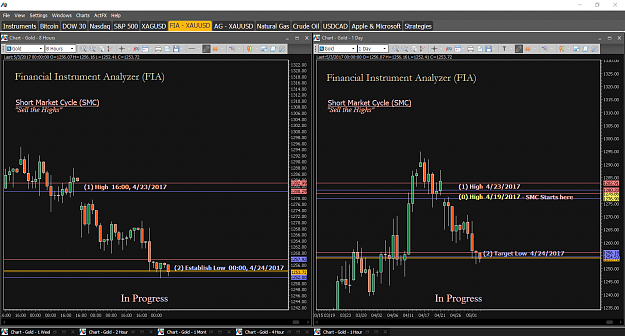
On the chart below, traders can see that the market has now reached the target levels calculated and indicated by the FIA on 4/24/2017 as per my previous post. This is yet another example which demonstrates the FIA's telling ability to predict ...
Ollio's Gold - Supply and Demand
- jackeollio replied Apr 26, 2017
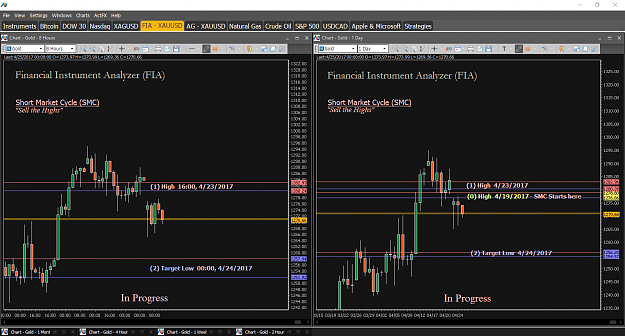
Market Cycle Reversal - beginning of a new Short Market Cycle On the Day chart below, traders can see yet another example of the FIA's early detection capability in terms of Market Cycle Reversals. Although I have not indicated it on the chart, the ...
Ollio's Gold - Supply and Demand
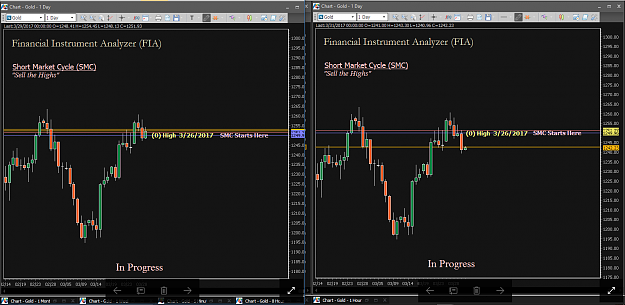
- jackeollio replied Apr 20, 2017
The chart below is an example of how the FIA is able to detect and predict Market Cycle Reversals (in this case, the end of a Long and beginning of a new Short market cycle) ...
Ollio's Gold - Supply and Demand

- jackeollio replied Feb 23, 2017
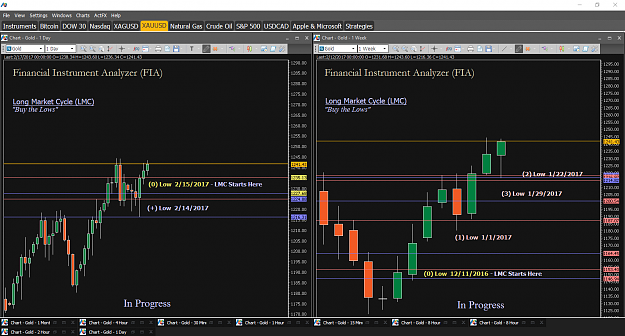
Below is irrefutable evidence that the FIA predicts market direction and technical levels ... As you can clearly see from the chart below, Gold remains in a Long Market Cycle on both timeframes (i.e. Day and Week). On the Day chart, the FIA ...
Ollio's Gold - Supply and Demand

- jackeollio replied Feb 15, 2017
Well, if you look carefully at the chart I have posted above, you have no choice but to agree that the FIA did predict the High and the Low. In fact, the FIA predicted the Low on 1/22/2017, nearly 4 weeks ago!!! The chart above simply confirmed that ...
Supply and demand in a nutshell by Alfonso Moreno
- jackeollio replied Feb 15, 2017
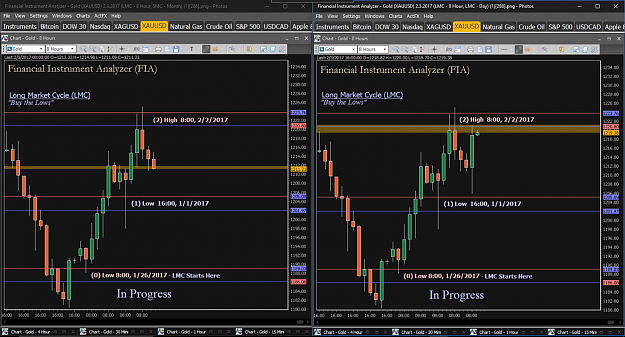
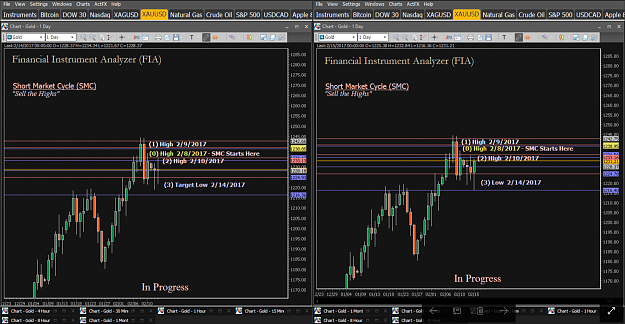
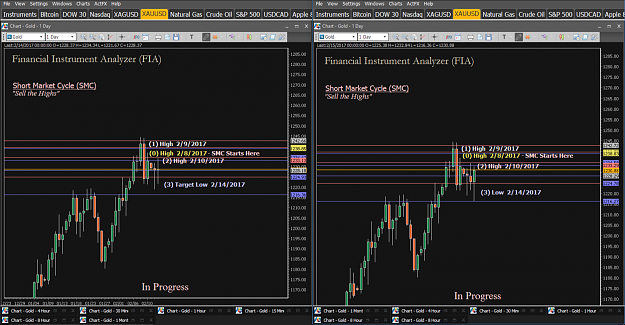
Below is an example of Supply & Demand accurately calculated by the Financial Instrument Analyzer (FIA). On the left-hand side is a screenshot of the Day timeframe taken on 2/14/2017 (yesterday) while on the right-hand side you have a screenshot of ...
Supply and demand in a nutshell by Alfonso Moreno
- jackeollio replied Feb 15, 2017
On the left-hand side is a screenshot of the Day timeframe taken on 2/14/2017 (yesterday) while on the right-hand side you have a screenshot of the Day timeframe taken 2/15/2017 (today).
Everyday forecast for GOLD
- jackeollio replied Feb 15, 2017
On the left-hand side is a screenshot of the Day timeframe taken on 2/14/2017 (yesterday) while on the right-hand side you have a screenshot of the Day timeframe taken 2/15/2017 (today). Notice how the FIA predicted the Low @1216.36 yesterday (see ...
Ollio's Gold - Supply and Demand