- Search Energy EXCH
- 31 Results
-
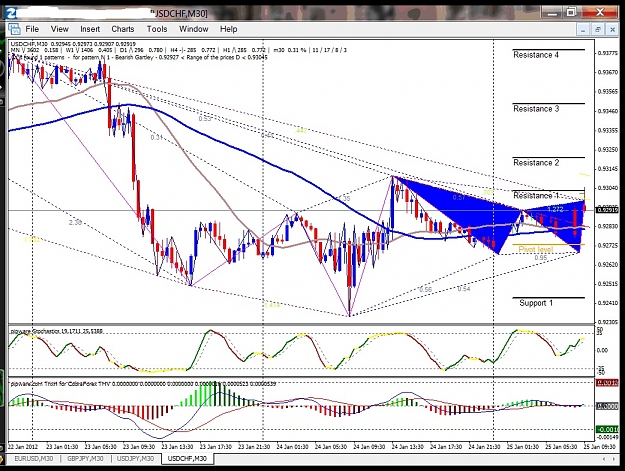
 iono replied Jan 25, 2012
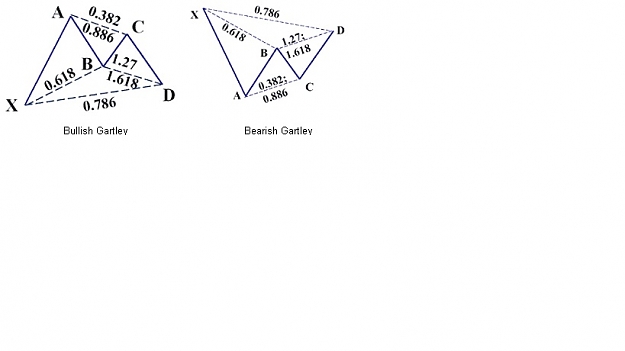
I don't know this seems to be a pretty consitant pattern bearish gartley, or look at the variations of ABC patterns i.e. W and M all from the aforementioned types of analysis, I think there has been much success with this type of analysis and ...
Gann Analysis
- iono replied Nov 29, 2011
Well we have a nice pattern and sell signal on the hourly chart, however I would wait until the U.S. open before attempting might get a push to the 3475 area as I think Hopium is driving things right now (hopium, word courtesy of Piptrapper)
EURUSD
- iono replied Sep 27, 2011
How about this, we are ranging until we get a solid break beyond the two yellow areas....trade accordingly using stops in either of these areas...long or short up to you, your money...
USD/JPY Discussion
- iono replied Sep 6, 2011
Right 77.30 did not hold, however can you really call that a normal attempt at breaking the line and now an overall change in trend...I think we will see more ranging with more emphasis on the downside...my two cents, worth 2 cents (I entered the ...
USD/JPY Discussion
- iono replied Sep 1, 2011
Two great short trades one on EURUSD and EURGBP, I took the EURGBP on a thirty minute chart 4 lots in at 8837 out at 8822...wanted to jump on the EURUSD trade. however I deal with a slow internet connection and didn't like my choice of entry at the ...
Extracted Thread (per thread starter's request)
- iono replied Aug 24, 2011
May be to soon, but attempting a short position 77.03 SL 77.30 with a target of 76.75 a bit lopsided, but we will see. (I say a little to soon as I should probably let the Asian markets warm up a bit, as I write this it is moving against me)
USD/JPY Discussion
- iono replied Aug 21, 2011
Well I just punched out at 76.55 as the price actions was bouncing up and down off of my 24ema and 60 sma, so take the profit and look for another entry I actually got out at 76.60...slow internet and slippage, BASTARDS!!!!!!!!!!!!!!!!!!
USD/JPY Discussion
- iono replied Aug 21, 2011
I can see what you are looking at with the fib retracements, my pivots and S/R are from an indicator named fibo grad, my 23% sits between my R1 and R2 on a 4hr chart this is from the extreme high and extreme low during the previous intervention. ...
USD/JPY Discussion
- iono replied Aug 21, 2011
Well I just went short at 76.77 (spread 3 pips) SL at 77.05 and target at 76.50, with this move up over the weekend I collected about 35 pips on a long, so taking the short and will reload long below 76.50.....
USD/JPY Discussion
- iono replied Aug 19, 2011
Ok I just wanted to be the first and last into the new weekend to bring up the gap issue, now it is out there so no need for anyone else to post about the gap issue
EURUSD

- iono replied Aug 19, 2011
So essentially if the markets are closed then there is an opening gap correct?
EURUSD


- iono replied Jul 18, 2011
EURUSD — I realize your method takes into account the 4 hr chart first, but this might be worth a look as the EURUSD has broken through the upper channel on the 1hr chart, during this time period i.e. before and about he first hour or so of ...
A method to trade Shi-channel
- iono replied Jul 18, 2011
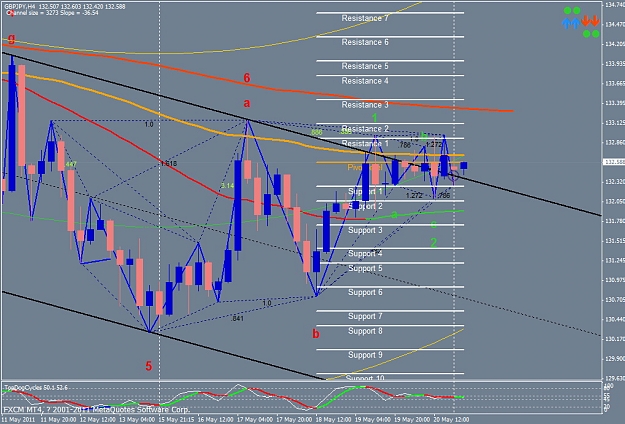
GBPJPY — It is an hour before the Asian open 19 July, on the 4 hour chart it is about to touch or bounce off the upper limit area, However my cycle indicator shows me I'm at the bottom of the cycle on 4 hr, however 1 hour shows cycle high, but ...
A method to trade Shi-channel
- iono replied Jul 16, 2011
MyShi — Here is how I use the Shi indicator, not taking over the thread just another example of the indicator, you can see that if patient enough it can be used very effectively for grabbing those pips, on that note yeah the chart looks busy, ...
A method to trade Shi-channel
- iono replied Jul 16, 2011
SHI Indicator — I've also been using the SHI Channel indicator for the past few months, coupled with counting waves, M, W, Butterfly patterns it is a useful tool...yeah there are times it blows past the top or the bottom, but if you set up ...
A method to trade Shi-channel
- iono replied May 22, 2011
My thoughts — I always find it hard to call anything on the Sunday afternoon, Asian Morning session after the weekend as there always seems to be a lot of fakes or little to no direction...yeah can range trade it..... My thoughts, has to crack ...
GBP/JPY, GBP/USD, and EUR/USD (technical analysis)
- iono replied May 2, 2011
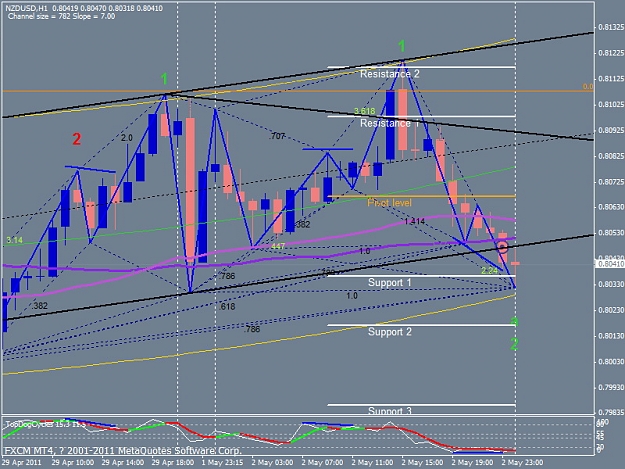
Yup and now I sit and stare at my chart; buy the dip or wait for pull back and go short.....I may enter at around 8030 buy to my pivot area 8068 see how it reacts from there to turn around and short.
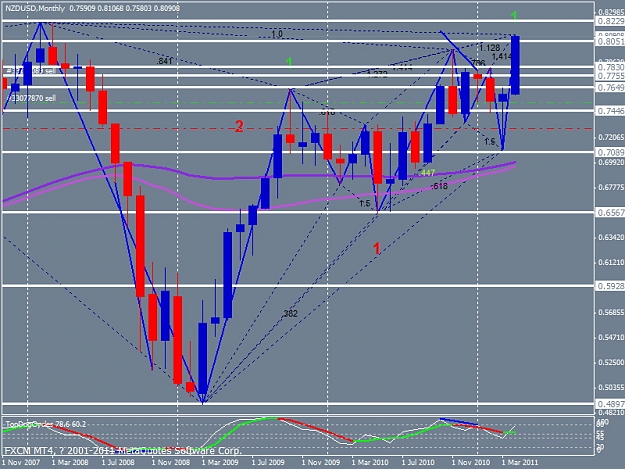
NZD/USD
- iono replied Apr 29, 2011
Not only was I engaged to a position, but now I'm married to a couple of shorts....looks like we will see longs until the 8220-30 area, would be a nice place to short, however will attempt long from here once the market opens for that target area. ...
NZD/USD