- Search Energy EXCH
- 11 Results
- incrediblefx replied Jun 27, 2010
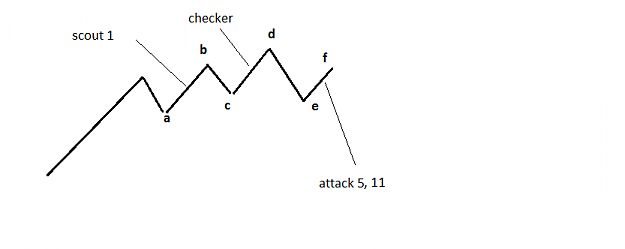
GEFX, actually this chart is similar to what happened with my trade yesterday. I sent in scout and I thought the dealers are just shooting the ducks around that level. My short briefly in the money but suddenly it went up really fast. (I didn't know ...
Technical Analysis Fallacy
- incrediblefx replied Jun 23, 2010
I think, the confusing part is how to interpret your sequence into chart. I've attached the scenario you put up and the chart I draw. I still do not know where to profit taking happens. url
Technical Analysis Fallacy
- incrediblefx replied Aug 19, 2008
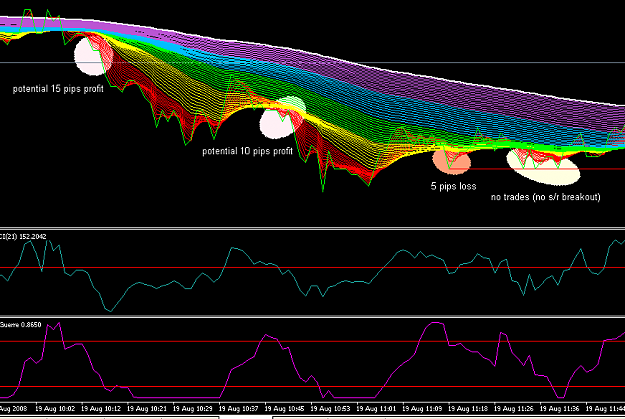
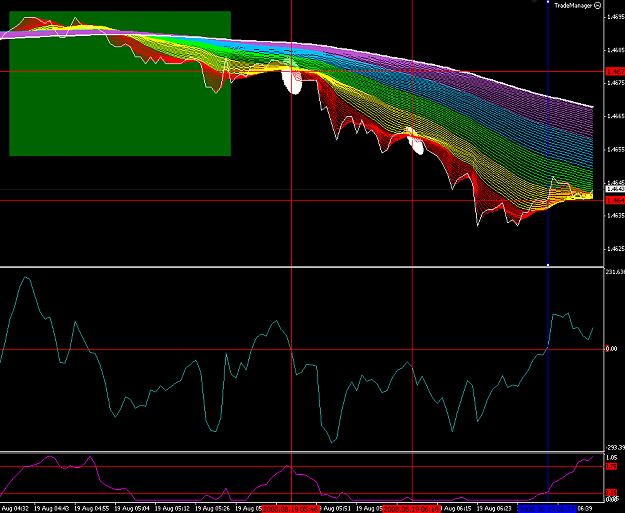
from last few experience the best is to avoid trading when the trend is not yet formed. I've attached a picture in which the red lines crossing down the 200MA but the green box is the non-trade area. The simple reason: - All the rainbow colors are ...
Scalping the Rainbow
- incrediblefx replied Aug 18, 2008
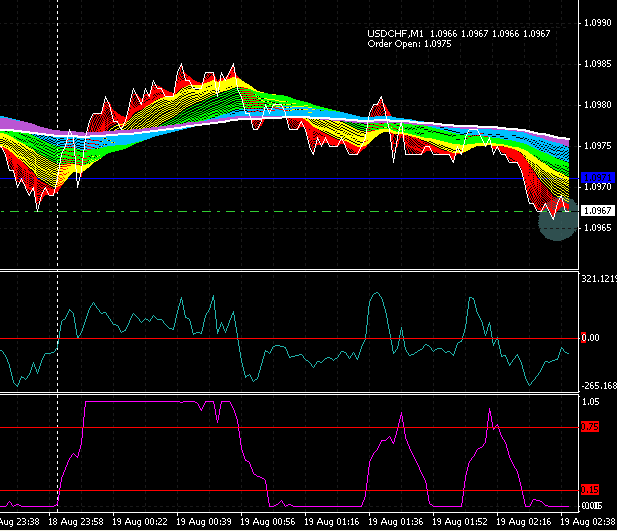
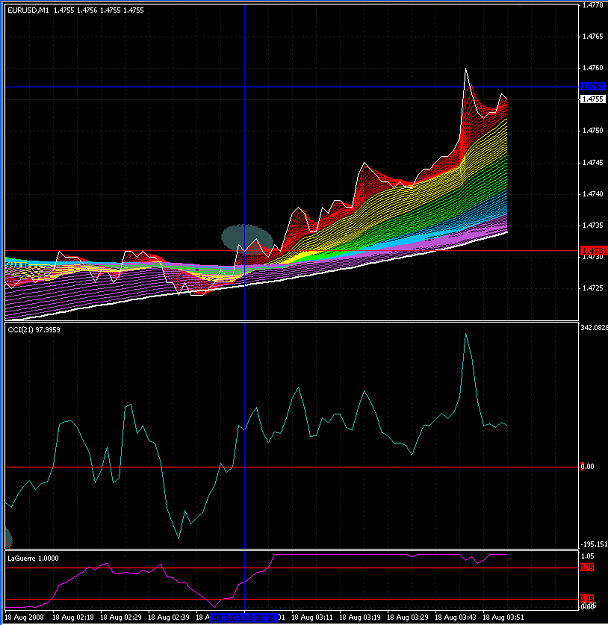
entered the trade at breakout level after the rainbow opens up. please comment what is wrong?
Scalping the Rainbow
- incrediblefx replied Aug 18, 2008
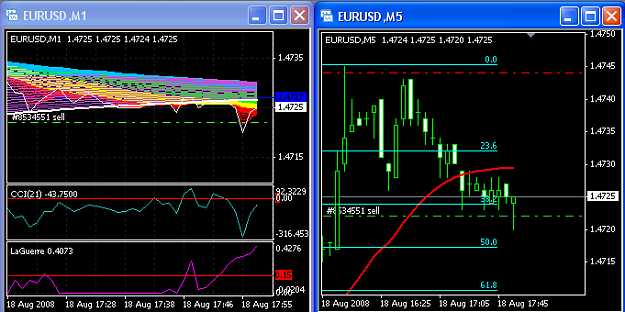
this trade is still running on demo. Take it because: - it breaks the 38.2 fibo on 5 min chart. - the price came out from 200MA for 2nd time to create break out
Scalping the Rainbow
- incrediblefx replied Aug 18, 2008
currently I use fibonacci as s/r line and also an entry point. As for this example the entry was 50% fibonacci breakout.
Scalping the Rainbow
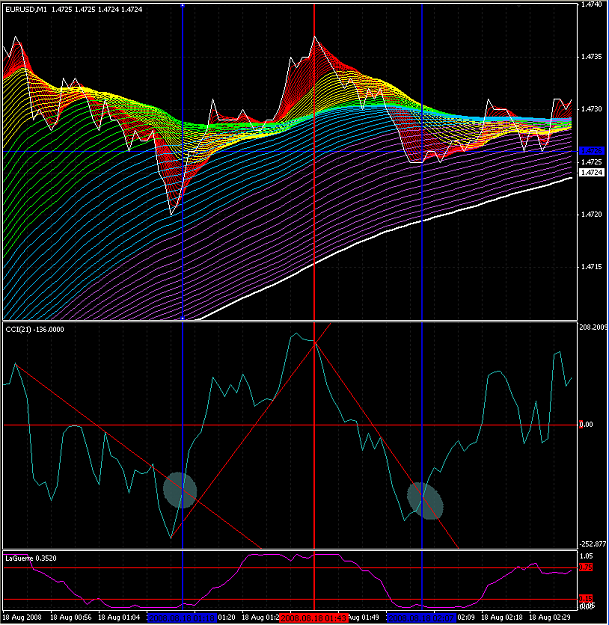
- incrediblefx replied Aug 17, 2008
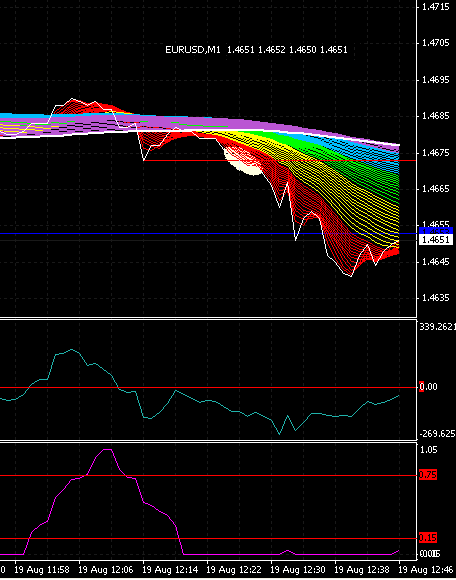
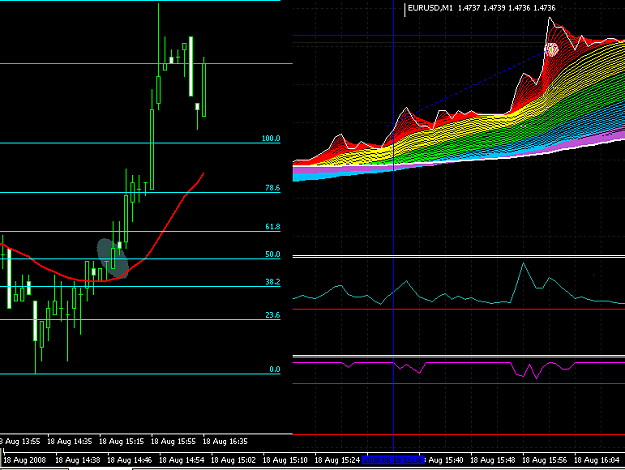
Hi 4xq, I attach a scalping entry based on CCI downtrend breakout. There were 2 Long entries if it's based on CCI however the CCI were still below 0 and this violates the wolfenstein rule. The 1st entry there are 12 pips to be made while the second ...
Scalping the Rainbow
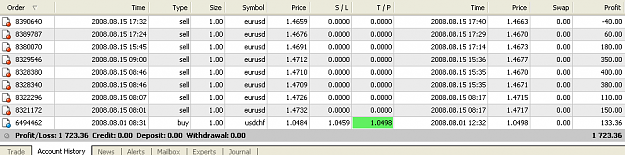
- incrediblefx replied Aug 15, 2008
I'm just halfway through this thread and tested a number of trades with good result (of course in demo platform). Hope, can do consistently in the next few days/weeks...
Scalping the Rainbow
- Posts by Member Search: 'incrediblefx'