- Search Energy EXCH
- 39 Results
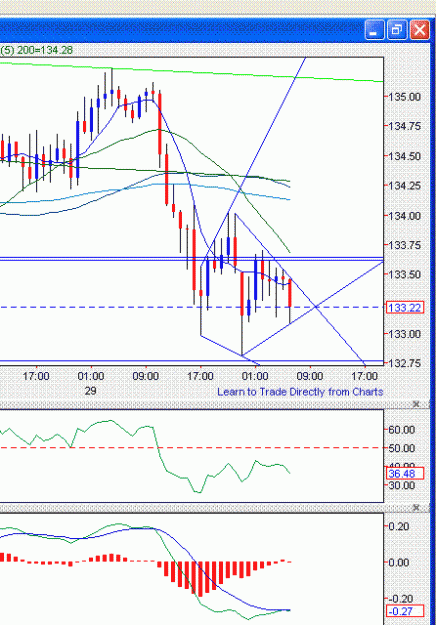
- hindart replied Jun 29, 2010
well, I see a nice dimond formation on H1, along with divergence in both MCAD and RSI. If 133.6 is taken it going to revisit the 135 mark. IMHO. edit: Another point is 200SMA on H4 is still intact.
Auslanco - GBP/JPY and GBP/USD (newstrade)
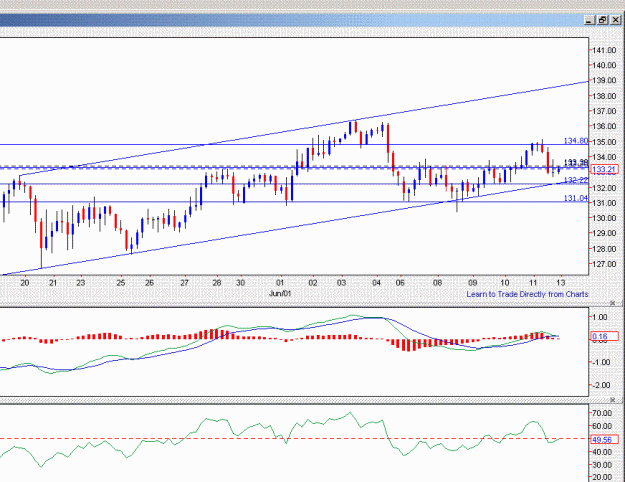
- hindart replied Jun 12, 2010
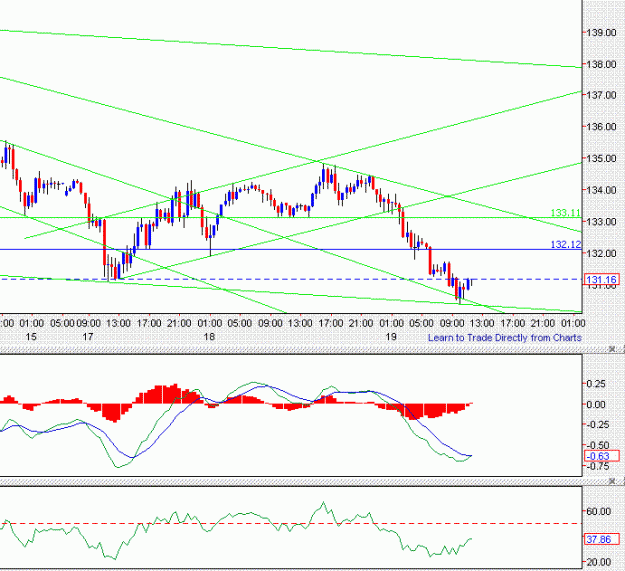
My Take on GJ — Here is my take on GJ. As of now its completely in uncertainty and next couple of days should clear things up. Main areas to watch out is 132.2 on down side, if that line is broken we will see 126 area again. On the up side if ...
Auslanco - GBP/JPY and GBP/USD (newstrade)
- hindart replied Jun 8, 2010
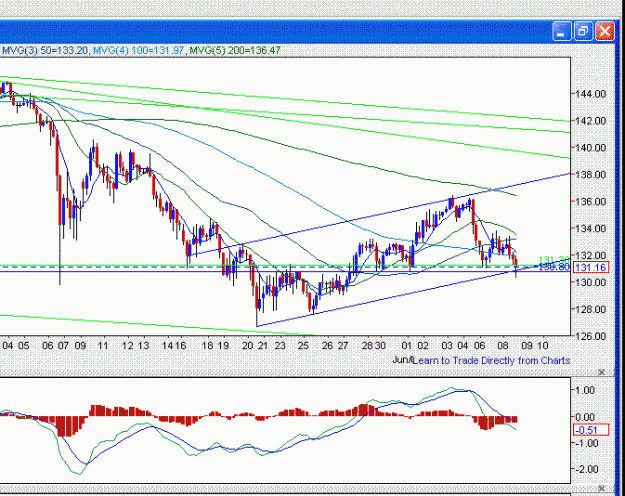
LTL and support line is still holding on H4 so longs are valid. just my 2cents
Auslanco - GBP/JPY and GBP/USD (newstrade)
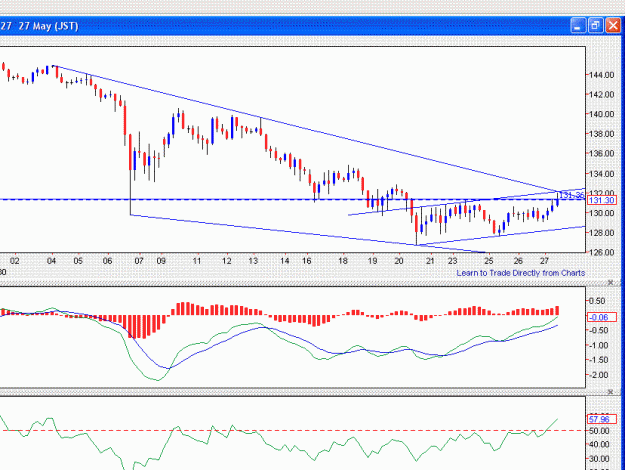
- hindart replied May 27, 2010
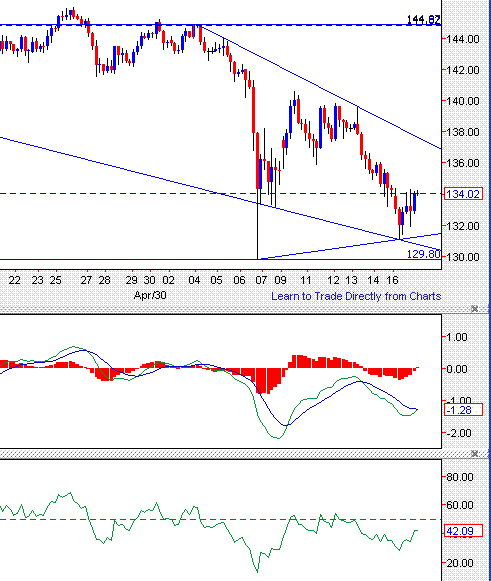
still belwo the H4 trend line. — I still feel it has not got out of the the bearish flag even on 1H, on 4H it is still below the major TL. 130 is one the cards from 1H point of view and 129 if 4H does not close above131.4. charts attached. ...
Auslanco - GBP/JPY and GBP/USD (newstrade)
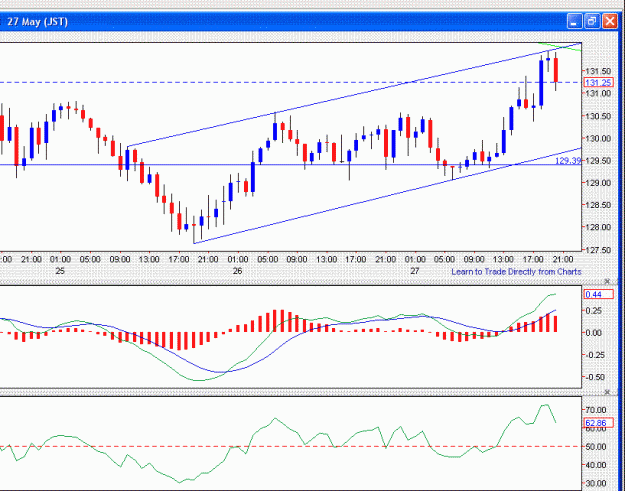
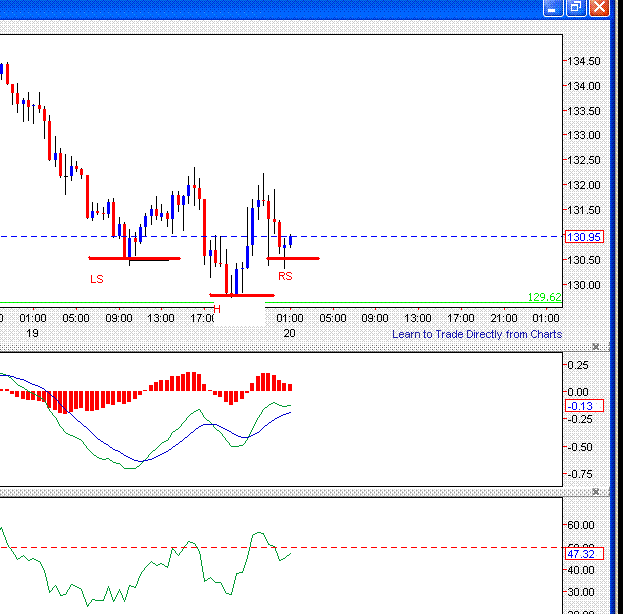
- hindart replied May 19, 2010
looks like it is making reverse H&S on M30 and H1. Or from other angle you can say its diamond bottom on H" and H4 with proper MCAD and RSI position. It is going for a healthy retrace I believe. I am long @131 with 75 pip stop loss.
Auslanco - GBP/JPY and GBP/USD (newstrade)
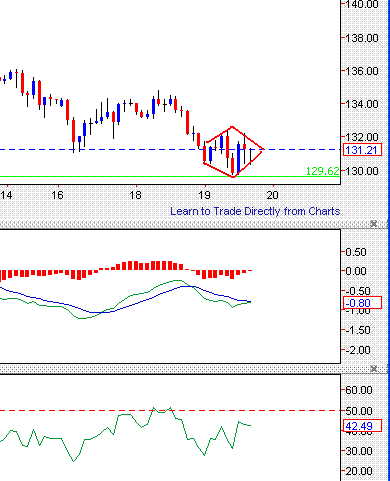
- hindart replied May 18, 2010
forgot my chart here it is. plain and simple!
Auslanco - GBP/JPY and GBP/USD (newstrade)
- hindart replied May 17, 2010
I believe 136.6 is coming before 130! quite nice divergence on H4 and pin bar on daily
Auslanco - GBP/JPY and GBP/USD (newstrade)
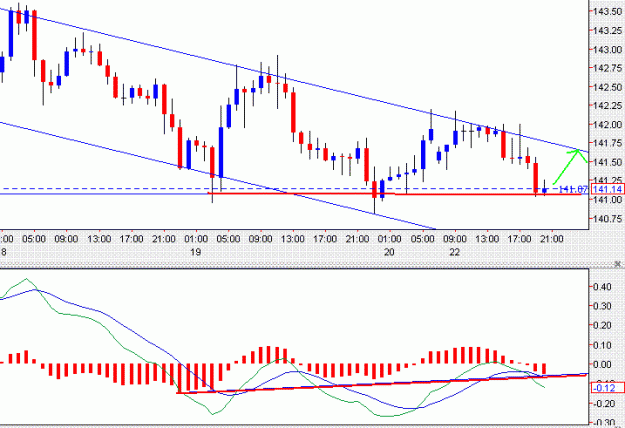
- hindart replied Mar 18, 2010
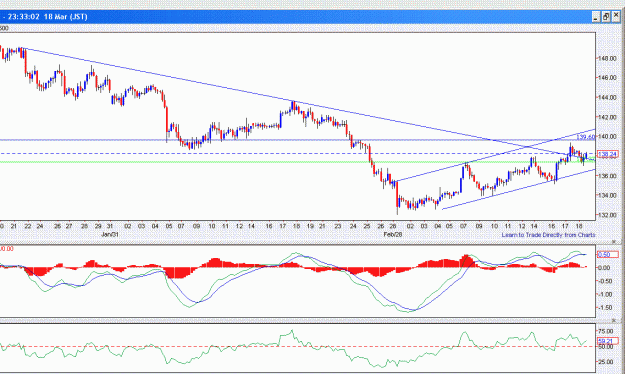
Just an Idea. it has broken one major UTL and retested it. It may go to 139.6 and may up to 140.5 before heading down. 1H MCAD has turned bullish. 4H rsi has just bounced up. lets see!
Auslanco - GBP/JPY and GBP/USD (newstrade)
- hindart replied Mar 16, 2010
If 138 is taken out I am looking for 140 at least!
Auslanco - GBP/JPY and GBP/USD (newstrade)
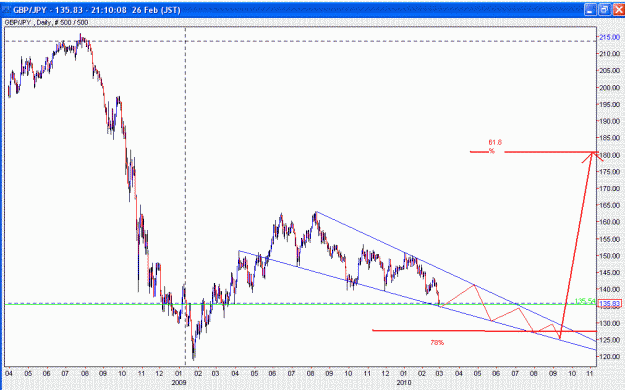
- hindart replied Feb 26, 2010
i agree, but not in straight line. attached is my long term daily chart. i am still noob and opinions most welcome.
Auslanco - GBP/JPY and GBP/USD (newstrade)
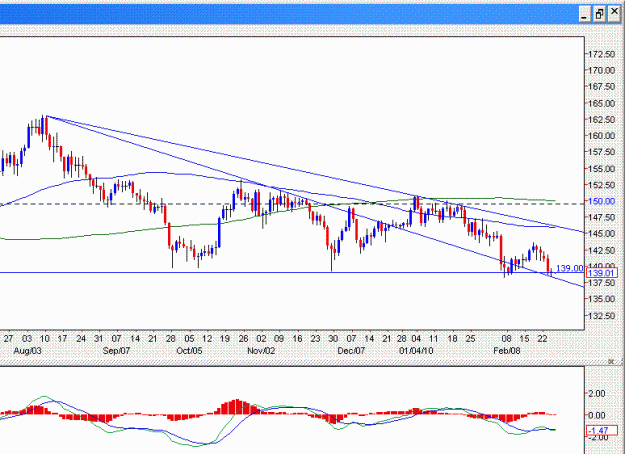
- hindart replied Feb 24, 2010
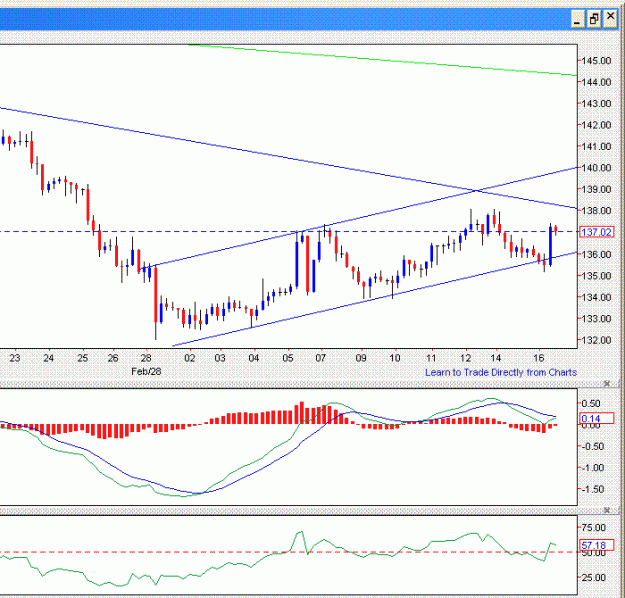
IS not this weekly TL and Horizontal support line holding it together? It also coincides with 78.2% fib fan on last up move on weekly. Comments welcome"
Backing Trades Thru Charts
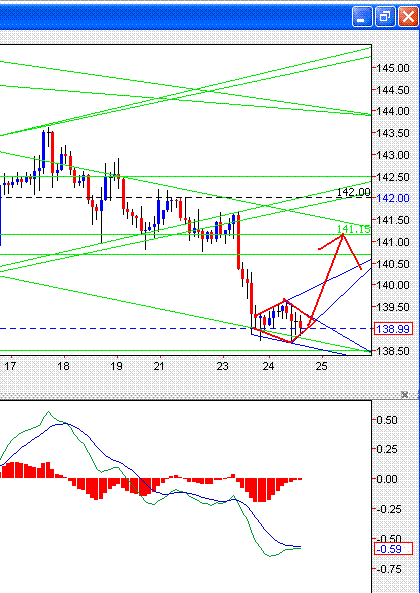
- hindart replied Feb 24, 2010
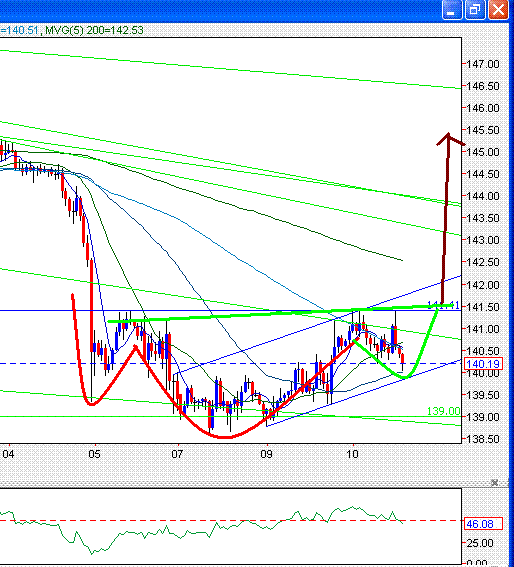
took small long at 138.96, looks like diamond bottom on H2 to me. Any comment welcome. Target141.
Auslanco - GBP/JPY and GBP/USD (newstrade)
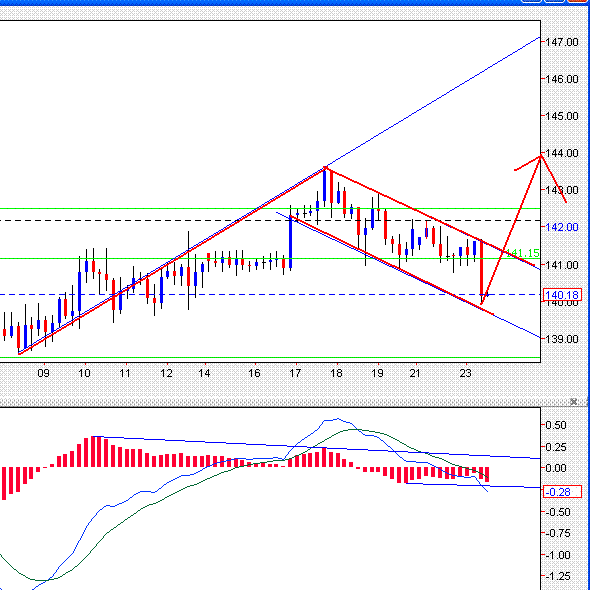
- hindart replied Feb 23, 2010
cant this be a bull flag? — please comment! cant this be a bull flag? with bearish divergence already played out bearish divergence in making. it also coincides with LTL and support? anyway took a long at140.05
Auslanco - GBP/JPY and GBP/USD (newstrade)
- hindart replied Feb 22, 2010
Exactly same chart I have, and its showing divergence on MCAD, if plays out it should got to 141.6 at least and if broke up, who knows?
Auslanco - GBP/JPY and GBP/USD (newstrade)
- hindart replied Feb 19, 2010
just my opinion of pitchfork basis. I am learning it as it seems pretty interesting. There are two pitchforks ( Red and Green ) on weekly and both have upside breakouts. Accordingly if it plays out it should hit 157/158 first then 165. IMHO. Smaller ...
Auslanco - GBP/JPY and GBP/USD (newstrade)
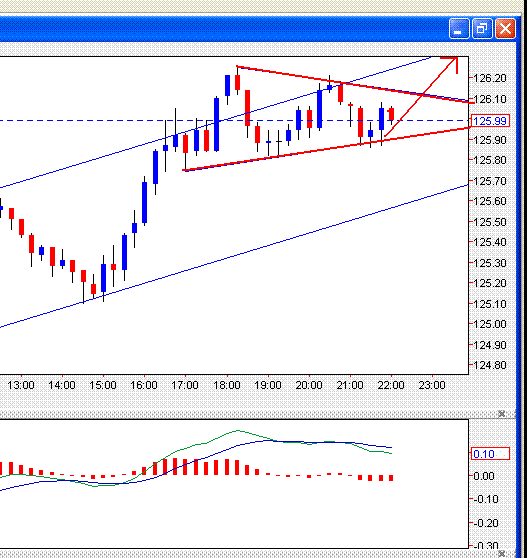
- hindart replied Feb 18, 2010
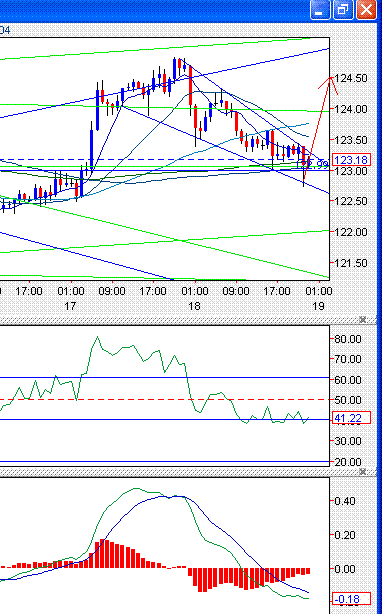
falling wedge on EJ — I see falling wedge on EJ, it is going to break up target 126.5
Auslanco - GBP/JPY and GBP/USD (newstrade)
- hindart replied Feb 10, 2010
H1 chart: is this a H&S in making?
Auslanco - GBP/JPY and GBP/USD (newstrade)
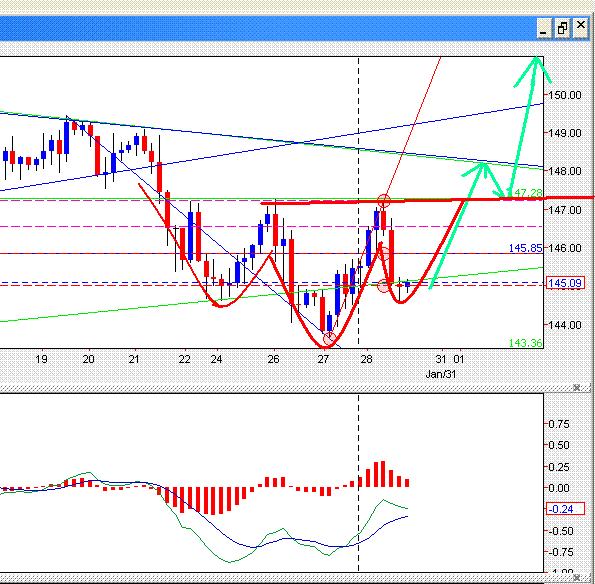
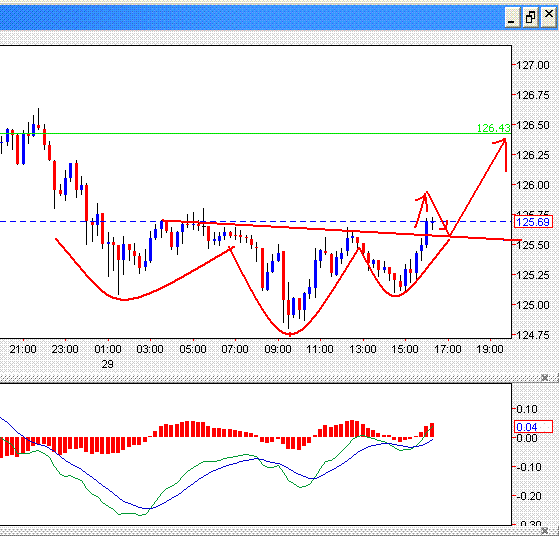
- hindart replied Jan 29, 2010
I am not sure but I llok like most people does nto like H&S setup here. I am quite new in FX but has seen working H&S quite a few time. Here is one more you, Neck line already broken, buy on retest. target 126.4
EUR/JPY Anytime!
- hindart replied Jan 28, 2010
yup, i am there too, had posted this yesterday also
Auslanco - GBP/JPY and GBP/USD (newstrade)