- Search Energy EXCH
- 20 Results
-
 hendrix replied Oct 12, 2008
How often to redraw S&R levels? — Hi BillyRay, I was wondering, how often should we redraw our S&R levels? For example, if I mark up S&R's on EUR/USD, should I leave those levels for the next whole day and try to trade from those levels ...
No Brainer Trades
- hendrix replied Aug 27, 2008
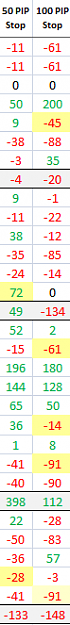
True, but I suppose, that the A.H. has less work to do when recovering the loss. Here is a screen shot of all the "what if" scenarios (based on my trades) of 50 pip TSL's and 100 pip TSL's. It starts on May and ends in August. (I won't take any more ...
Jacko's Forex House of Pleasure and Pain
- hendrix replied Aug 23, 2008
@Fx_Genius: LOL =) That was cool. Btw, does any of you consider to go long at 1.4750? It seems like a nice opportunity, but I have a feeling, that the current (medium term) sentiment about USD is mostly bullish among professional fund managers... ...
Jacko's Forex House of Pleasure and Pain
- hendrix replied Aug 21, 2008
Hi, anyone remembers my two posts about measuring implication of channels? It's basic TA and it seems to work again and again and again... See the attachment.
Jacko's Forex House of Pleasure and Pain
- hendrix replied Jul 11, 2008
Channels and Trendlines Have Measuring Implications — Hello again, here is where I copied some texts about channels and trendlines, how they have measuring implications. Well, if the theory will continue to hold, we are bound to see a nice run ...
Jacko's Forex House of Pleasure and Pain
- hendrix replied Jul 10, 2008
That is about 330 pips down from the current level. You could make a trade when the price gets back to the daily trendline, which would be at around 1.5700. There is also an opportunity of buying at 1.5600, which is the current 50% fib level. Only ...
Jacko's Forex House of Pleasure and Pain
- hendrix replied Jun 27, 2008
Yeah, Jack is great.
Jacko's Forex House of Pleasure and Pain Yes, the current 50% fib on a daily chart would be at around 1.5550 - but I doubt it will go that far down anytime soon. I'm still a bit annoyed with myself for not placing a buy stop order at 1.5680 before the Federal Funds ...
- hendrix replied May 26, 2008
I too am looking to get back in at 1.5650. Reasons are: - a round number - trendline vicinity - previously strong s&r levels - 50% fib See the chart. Oh, and if we don't get to the 5650 level, then I'm looking to buy at 1.5800, after/if the price ...
Jacko's Forex House of Pleasure and Pain
- hendrix replied Apr 29, 2008
I'm a buyer at 1.5500 with a 100 pip TSL. A very round number and there was some support/resistance action going on around these levels. Although we don't use profit targets, I will close my position instantly, if my 100 pip profit target is hit. ...
Jacko's Forex House of Pleasure and Pain
- hendrix replied Apr 23, 2008
Hi! Yup, that's true, but I've seen Jacko (at DailyFX) buying at .xx25 also. I guess, in the end, it all comes down to experience, combined with other tools that Jacko uses. Here is a 4h chart attached. Again, the 50% fib worked very nicely and the ...
Jacko's Forex House of Pleasure and Pain
- hendrix replied Apr 4, 2008
Congratulations! I'm on the sidelines for now, but I'm looking to go long again @ 1.5550... But the truth is, I'm not quite comfortable at the moment... Are we again in a trading range? Are we going to see another channel breakout? Or are we going ...
Jacko's Forex House of Pleasure and Pain
- hendrix replied Apr 1, 2008
Hi, I have a pending buy order at 1.5525. Just in case if it drops that far. This is approximately where the price and the trendline would meet again, just the same as at 1.5350. Just a guess of mine.
Jacko's Forex House of Pleasure and Pain
- hendrix replied Mar 30, 2008
Hi friends, before I'm off to watch Star Trek (hehe... yeah, I like Star Trek very much) I'd like to share with you 2 textbook examples of Technical Analysis on channels and trendlines, since both are part of tools that Jacko uses. Channel lines ...
Jacko's Forex House of Pleasure and Pain
- hendrix replied Mar 26, 2008
Gagiul, I'm quoting you again, because it made me rethink the situation. I went long again @ 1.5750. Thanks. Btw, one of the best things I've learned is to flip the chart vertically and reexamine in from the opposite site. After I saw this strong ...
Jacko's Forex House of Pleasure and Pain
- hendrix replied Mar 25, 2008
I've closed my position and now I'm waiting for a dip. Maybe I should just let the trade to play itself out, but I'm happy with the pips I gained. 1.5530 would be another nice entry point.
Jacko's Forex House of Pleasure and Pain
- hendrix replied Mar 24, 2008
Yeah, me too. Anyway, I hope that the .5350 will be penetrated first and that I can buy it on the way up. Anyway, if the .5350 and .5300 won't hold, I'll rethink buying again at .5200 or .5150 (50% fib on the daily chart). I've attached a 4h chart ...
Jacko's Forex House of Pleasure and Pain
- hendrix replied Mar 21, 2008
Hi zoopy, While I can see the 50% fib you are talking about, I believe the 1.5300 level will show some support too. That's because: 1) It's a nice round number 2) It already acted as a resistance and support 3) A trendline (which started in early ...
zoopy's trading journal
- hendrix replied Mar 20, 2008
Btw, I'm a buyer @ 1.5300. This level was at first a resistance point and later it became a support. The supporting trendline would also add to confidence. Maybe I'm hoping for too big of a dip, but this is the level I'd be most comfortable to buy. ...
Jacko's Forex House of Pleasure and Pain
- hendrix replied Mar 17, 2008
Seems like a nice trade. The 1.5700 was roughly also a 50% fib retracement (1.5717) + it never went much lover from the previous upside gap. A very nice trade indeed.
Jacko's Forex House of Pleasure and Pain
- hendrix replied Feb 24, 2008
Hello friends, I've posted a daily EUR/USD chart with major Support & Resistance levels (green lines), 2 most important 50% Fib levels (yellow lines) and 2 potential buying points (blue lines). I'm still fresh to all of this but I study Jacko pretty ...
Jacko's Forex House of Pleasure and Pain
- Posts by Member Search: 'hendrix'