- Search Energy EXCH
- 159 Results
-
 genadi replied Mar 10, 2024
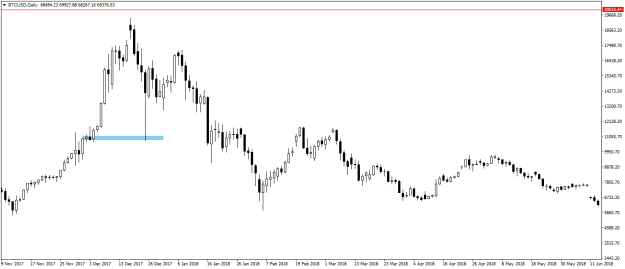
Ok. So 2200 still not touched. Maybe the retracement before the climb to this zone. Maybe we can compare it to Bitcoin in 2017-2018. image Price retraced a lot before going to the round number.
Gold
- genadi replied Mar 3, 2024
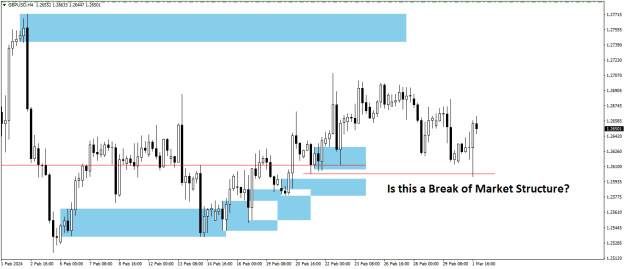
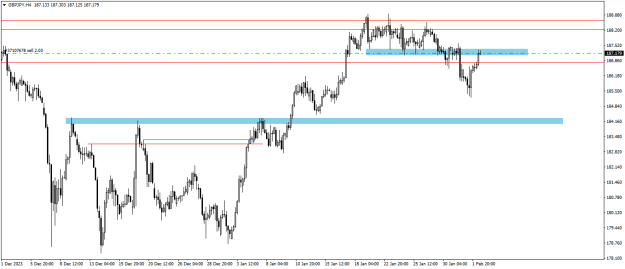
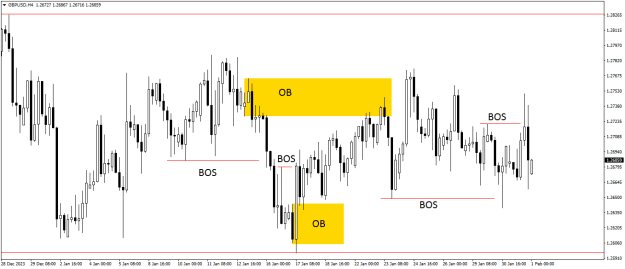
This is GU H4 chart. image How we should consider this action. Price broke recent low. But we did not reach the upper target yet. Should we consider this as BMS and look for a sell orders? Or we should consider this as a fakeout and still look for ...
Price Action Powerhouse: Unveiling S&D vs. S&R for Smarter Trades
- genadi replied Feb 27, 2024
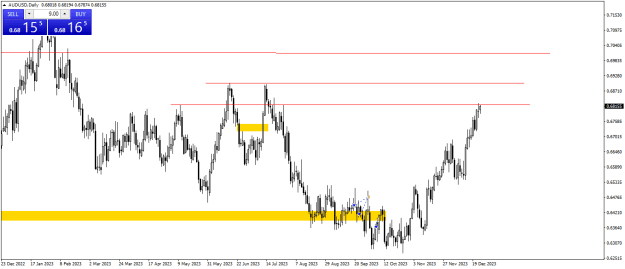
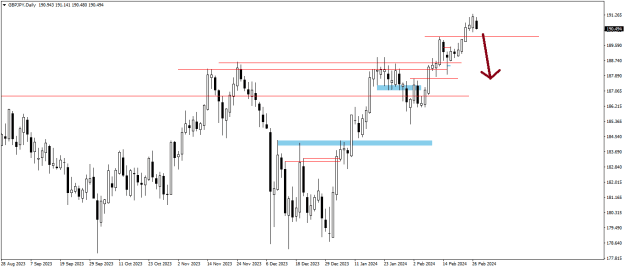
In a monthly chart we are hitting Quasimodo. We are on the top in daily chart. I think some retracement should happen now. image Yet, my order position is not very big, so I can allow myself to do this trade. But it is not the best RRR trade that ...
Cable Update (GBPUSD)
- genadi replied Feb 26, 2024
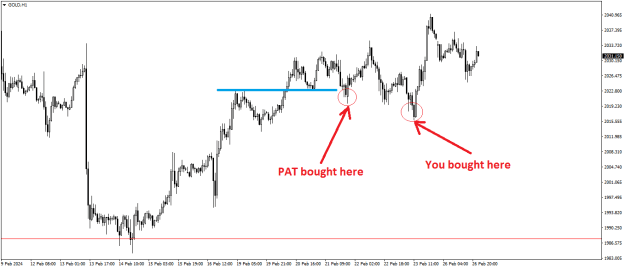
I guess we are talking about different places on the chart. Pat bought few days earlier than you. image
Price Action Powerhouse: Unveiling S&D vs. S&R for Smarter Trades
- genadi replied Feb 25, 2024
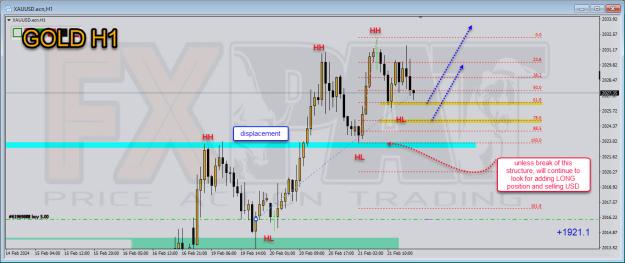
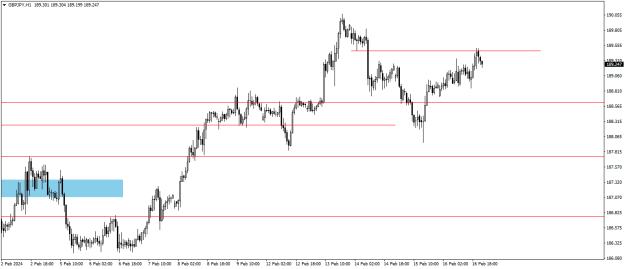
This is the question about Gold. I hope it is appropriate to ask questions here. When price broke high, returned and bounced up. Support became resistance. And the idea was to look for buy signals, unless price breaks S&R structure. image And then ...
Price Action Powerhouse: Unveiling S&D vs. S&R for Smarter Trades
- genadi replied Feb 25, 2024
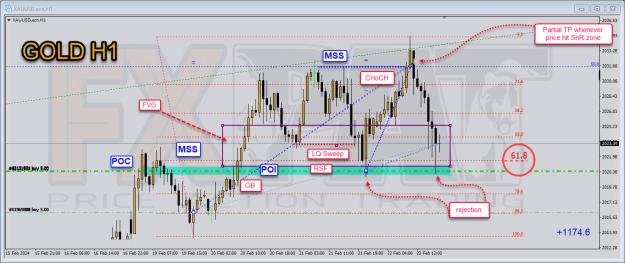
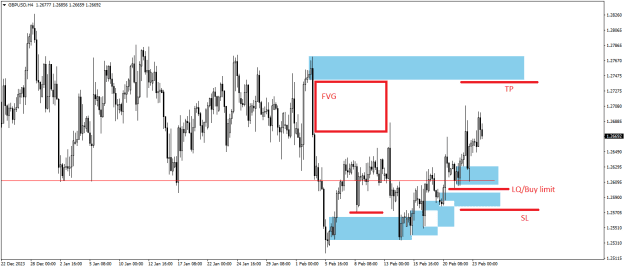
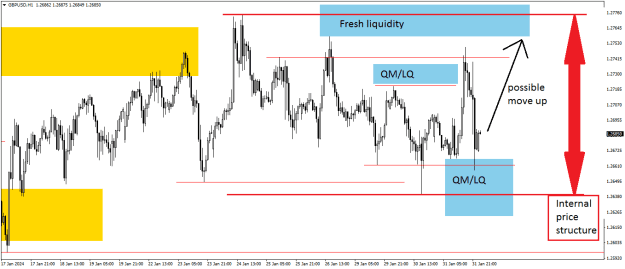
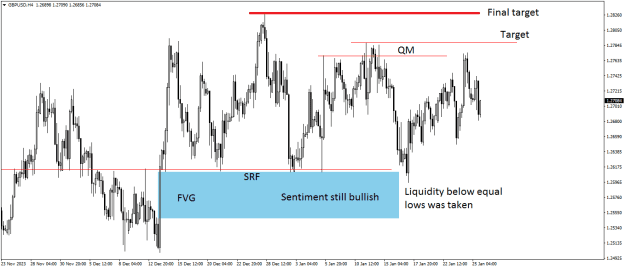
GBPUSD Price is climbing up, taking all demand zones (OB's), making higher highs. Possible target upper side of FVG. image
Price Action Powerhouse: Unveiling S&D vs. S&R for Smarter Trades
- genadi replied Feb 25, 2024
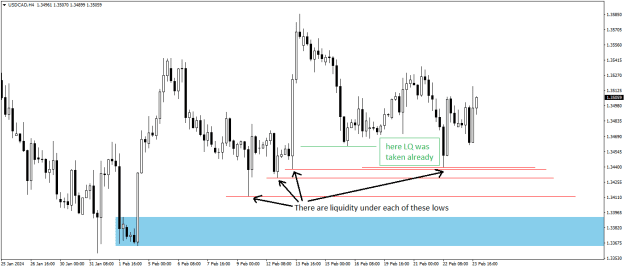
It is really hard to tell where the liquidity run will be. You can consider that liquidity lies under each high and low. image One of the most important questions is the question "What highs or lows has no (or very little) liquidity below/above ...
Price Action Powerhouse: Unveiling S&D vs. S&R for Smarter Trades
- genadi replied Feb 25, 2024
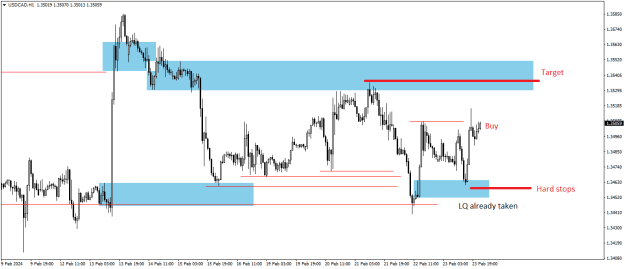
My view on USDCAD. Price in a range. Both buyside and sellside liquidity are taken. There is no clear sign where price are willing to go. It is better not to trade in these conditions. But this is my view. image
Price Action Powerhouse: Unveiling S&D vs. S&R for Smarter Trades
- genadi replied Feb 18, 2024
Question 1: can we get explanations of what every acronym means? (FVG - fair value gap, OB - order block) Question 2: how can we know where the real POI are? Are they Supply/Demand zones on the edges of FVG, that are also on HTF Support/Resistance ...
Price Action Powerhouse: Unveiling S&D vs. S&R for Smarter Trades

- genadi replied Feb 17, 2024
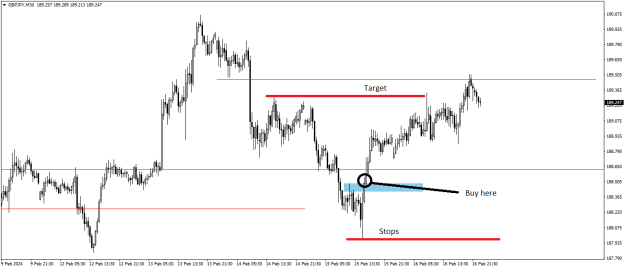
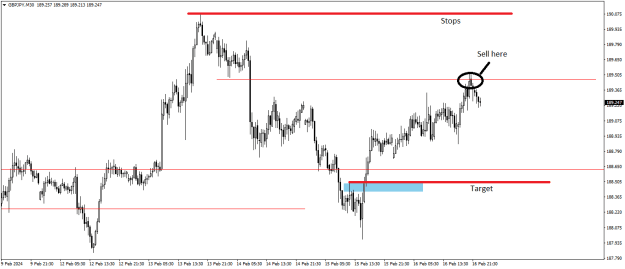
Well, you did not share your trades, so I hope you dont mind me sharing my view on where the orders should be placed. H1 chart: price broke Daily, Weekly highs. image We look for orders on M30 timeframe. First order should be placed here: image ...
Price Action Trading (PAT) - Amplifying Market Insights
- genadi replied Jan 31, 2024
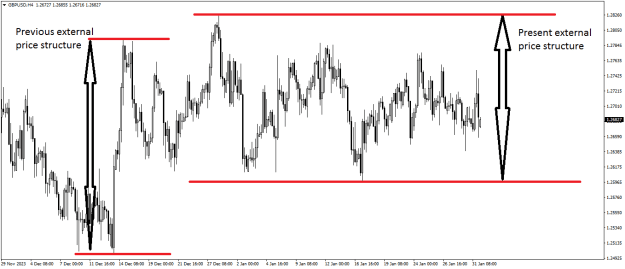
This is how i see the charts. External price range, we had before. And the new external price range we have now. The shift happened after the previous range's high was taken and new lows formed (the high is still not taken) image Then we have ...
Cable Update (GBPUSD)
- genadi replied Jan 25, 2024
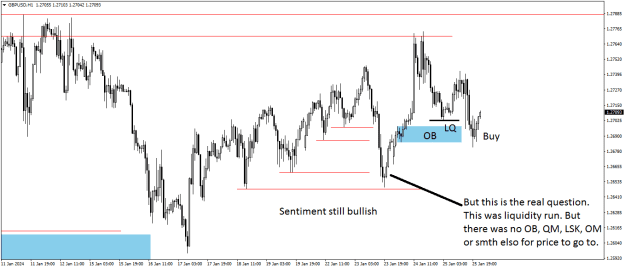
This was quite clear entry. On larger timeframe we still are in the bullish market. Price took LQ and moved up. image On lower timeframe (H1) price also took liquidity (this is the tricky one) and also moved up. This is also bullish market. image ...
Cable Update (GBPUSD)
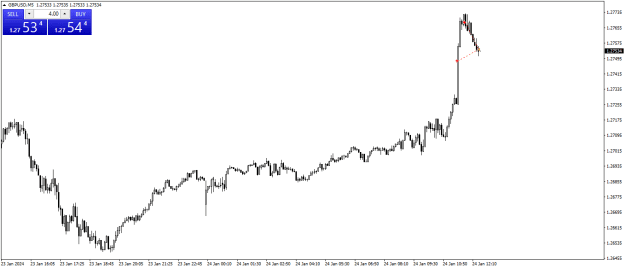
- genadi replied Jan 24, 2024
Took few pips. image I guess it is not news. It has something to do with yesterdays move to 1.2648. Maybe someone smarter will explain it better. Don't worry bro, you are a good trader, you will make much more next time.
Cable Update (GBPUSD)
- genadi replied Jan 24, 2024
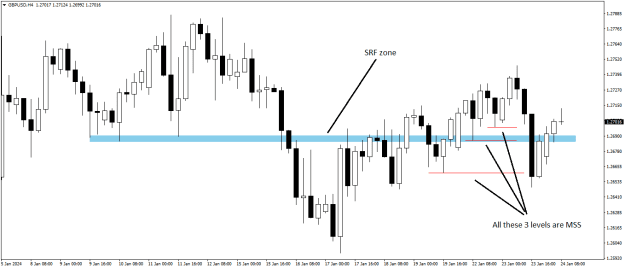
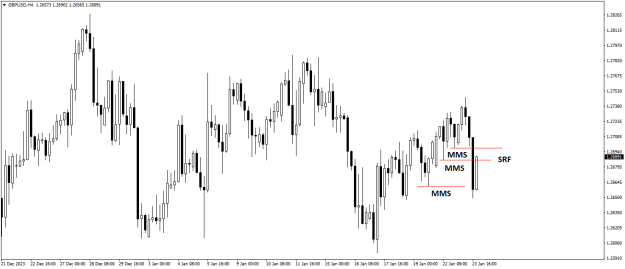
On H4 timeframe price is climbing up making Higher Highs and Higher Lows. But suddenly last Higher Low was taken (or 3 lows, depends how you look). image So now we can say that we have Market Structure Shift, which means we now are in bearish ...
Cable Update (GBPUSD)
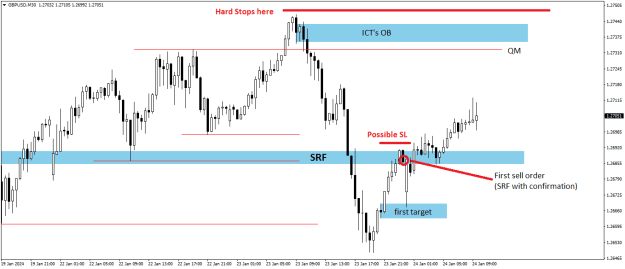
- genadi replied Jan 23, 2024
So this is valid sell setup? This is basic? image Or do you need to go for ICT drawing to get more info?
Cable Update (GBPUSD)
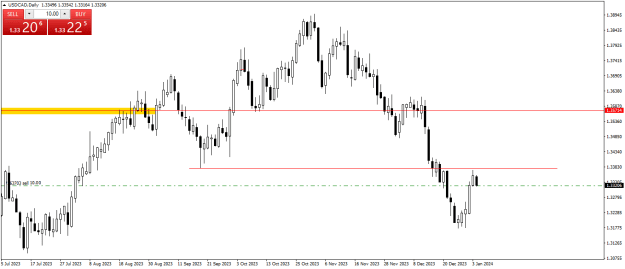
- genadi replied Jan 4, 2024
Sell USDCAD, little late, but it is still a good trade. Any comments? image
Cable Update (GBPUSD)
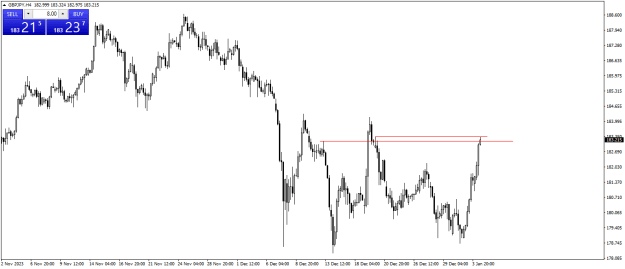
- genadi replied Jan 4, 2024
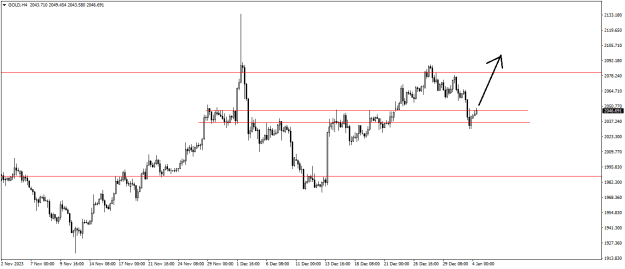
Gold, I see it this way. Guys, share your view. image
Cable Update (GBPUSD)