- Search Energy EXCH
- 40 Results
-
 freemind replied Oct 13, 2021
agree with you on this. i do the same. only if 15m is giving me opposite signs of my trade i monitor how the market will react to it, but everything below it its just minor. THOUGH, we both know that the change of trend starts on smaller TF and then ...
vsa with Malcolm
- freemind replied Oct 12, 2021
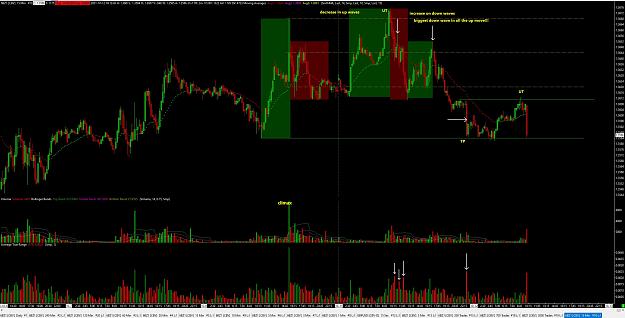
for one moment let's forget about what Gavin says and Wyckoff theory. lets think logically, if we are going down for several days in a row, with clear structure breaks LL & LH. then to stop that movement we need something significant, right? the ...
vsa with Malcolm
- freemind replied Oct 7, 2021
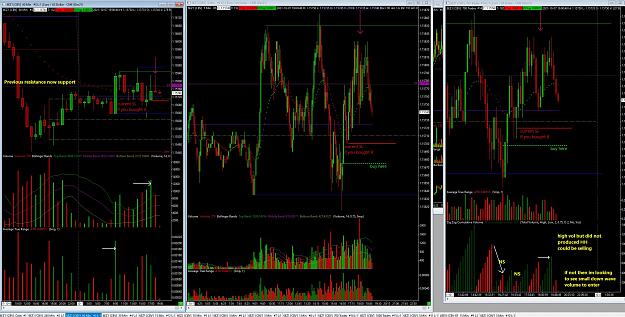
i dont trade eurusd as its often very slow and there are only couple of days in a month when it moves well. that is why i prefer indices. but i keep one eye on it. so here is my 2 cents: i would have traded the spring on 5min. why? we made HH in UK ...
vsa with Malcolm
- freemind replied Oct 5, 2021
my main charting platform is sierra charts where i use futures data feed and it looks very different. but i can tell you as before stated by other respectable traders - trade the volume you have on your charts. the important thing is how you read ...
vsa with Malcolm
- freemind replied Oct 5, 2021
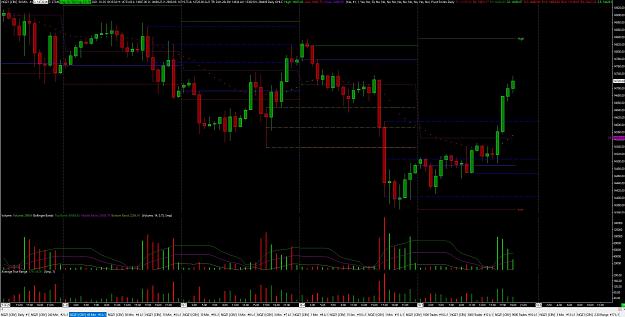
nasdaq was a good trade. was a bit late with entry as was trading other indices as well. and had a noob mistake (too tight SL on the second position), but overall +120p. wyckoff and WW gave several confirmations to this one. as lately posts here are ...
vsa with Malcolm
![Click to Enlarge
Name: [NQ100]M1.png
Size: 134 KB](/attachment/image/4052471/thumbnail?d=1633450372)
- freemind replied Sep 29, 2021
VSA comes from Wyckoff (its just a simplified version). one of the best Wyckoff teachers (to my mind) was David Weis, he created also weis wave - which looks at the volumes in the waves (cumulative). so we have easier to see the strength or weakness ...
(binned per thread starter’s request) Trend Trading with VSA
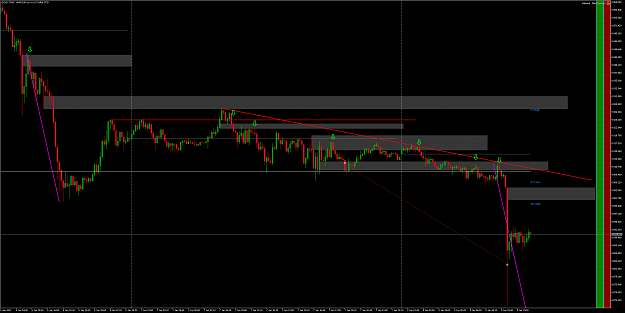
- freemind replied Sep 8, 2021
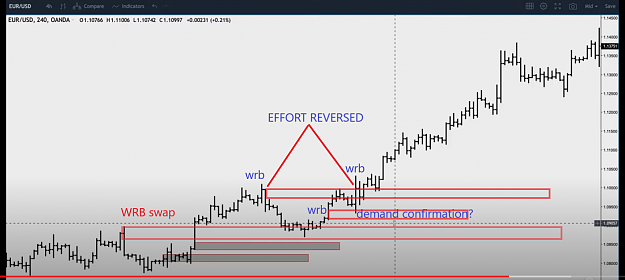
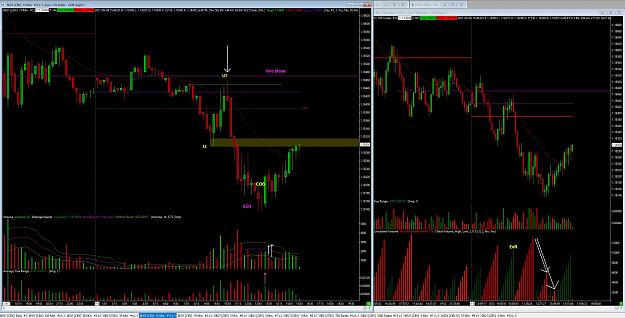
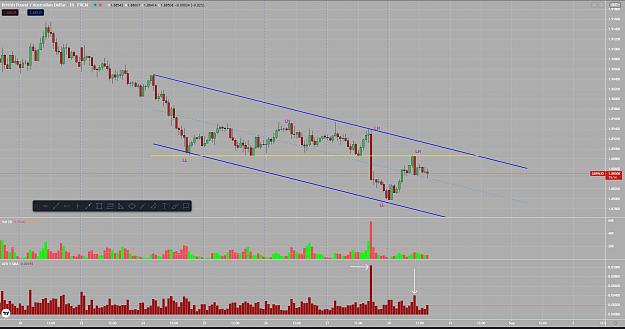
I use ATR of 1 below the vol, so i can easier spot WRB. the 15m bar that i marked as "COB" thats the biggest in the down move. always important to see market reaction to such bars. continue of the price chart- we see classic pattern previous support ...
vsa with Malcolm
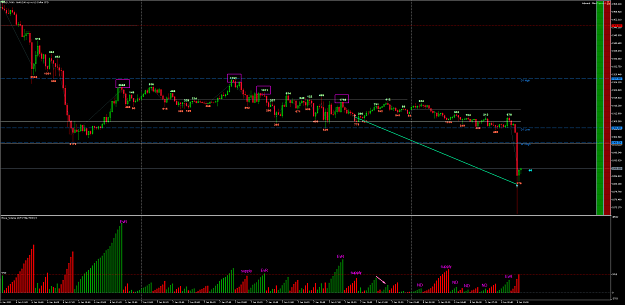
- freemind replied Sep 8, 2021
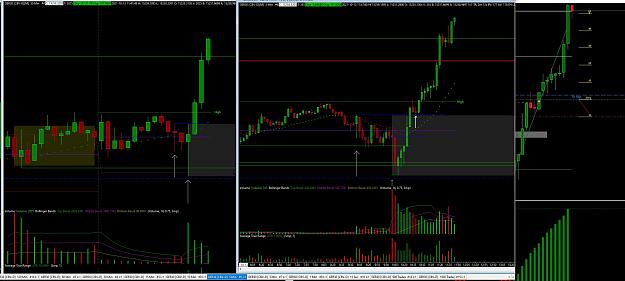
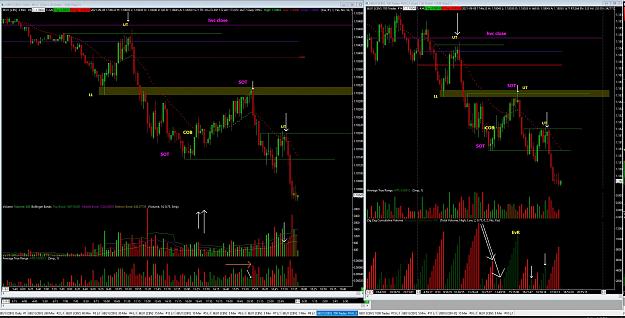
To my mind, the entry was too late. it had previously good entry points with several signs. see attached charts 15m and tick chart with weis wave (it clearly shows the exhaustion of supply). also, look at your chart, we have high vol down bar on 1h ...
vsa with Malcolm
- freemind replied Aug 30, 2021
i will add to Anotan's comment. we are in a downtrend, remember trend is your friend! there have to be some signs for change of trend if you want to catch a turning point- EvR, wave change, big vol, etc. here its nothing from that. we have LH and LL ...
vsa with Malcolm
- freemind replied May 27, 2021
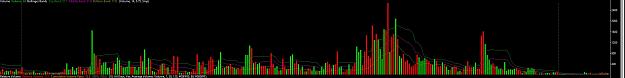
just put a Bolinger band on the volumes and it will work like a charm to see the spikes and the average vol...
vsa with Malcolm
- freemind replied Jan 12, 2021
I have a couple of questions: 1.why you had a buy limit in that exact place? If you wanted to have confirmation from the zone we already had a demand bar that price tested so the current bar on your chart would be an entry (2. why not to enter on ...
(binned per thread starter’s request) Supply and Demand, Price
- freemind replied Jan 8, 2021
zooming out the chart and looking at 5min we see at the highs of yesterdays WRB wick which created new lows so that's an important area (also on the previous picture the zone can be seen). was hoping the price will punch through it and move further ...
(binned per thread starter’s request) Supply and Demand, Price
- freemind replied Jan 8, 2021
does it get more obvious than this?
(binned per thread starter’s request) Supply and Demand, Price

- freemind replied Jan 8, 2021
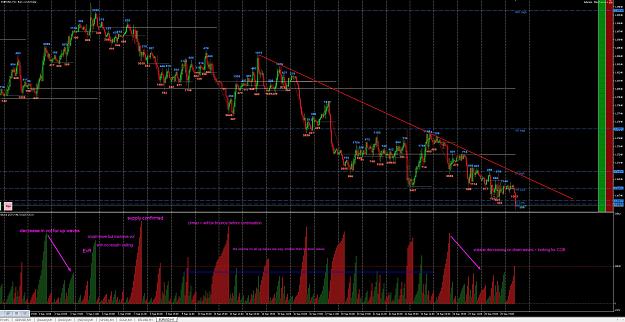
gold is a great example of why we want to respect the trend. of course all trends come to the end, but trend trading is definitely safer than counter-trend trading. Did not have the best entry and would have added in Asia, but was sleeping. ...
(binned per thread starter’s request) Supply and Demand, Price
- freemind replied Jan 8, 2021
practicing keeping trades overnight (have done that many times in the past, but with mixed results), now want to do that more often, like our guy Anotan does that. In choppy conditions WW can give you a better picture than regular vol. and after ...
vsa with Malcolm
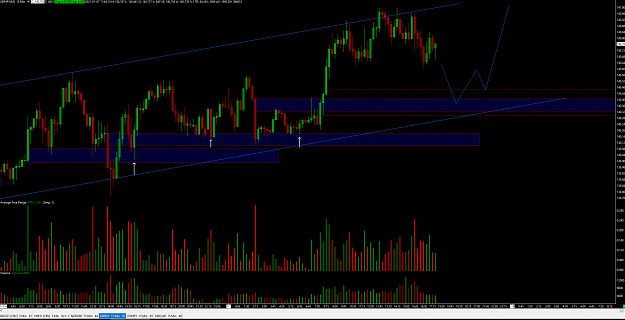
- freemind replied Jan 7, 2021
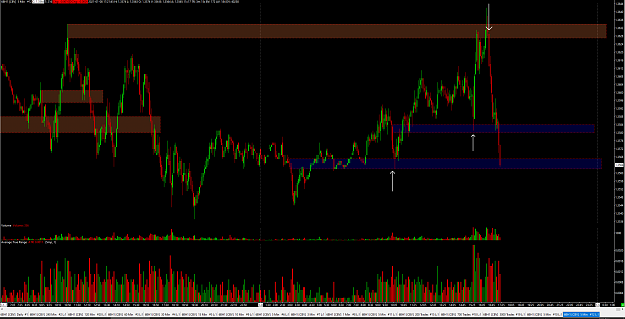
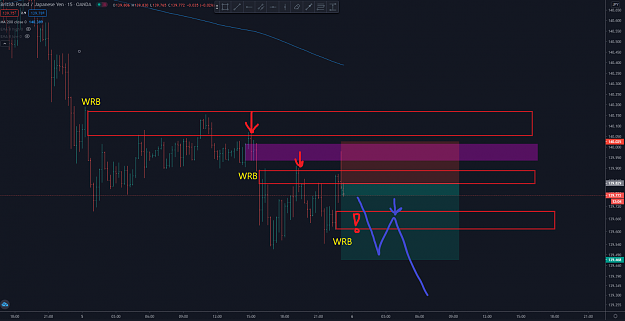
overall GJ is in the range phase for now, but we can still trade the range.
(binned per thread starter’s request) Supply and Demand, Price
- freemind replied Jan 5, 2021
im not WRB expert, but you are missing a couple of zones. i draw them on your chart. also, i suggest you to look at GBPUSD chart when you are trading GBPJPY as that would give you more confirmation (of course you can trade good without looking at ...
(binned per thread starter’s request) Supply and Demand, Price
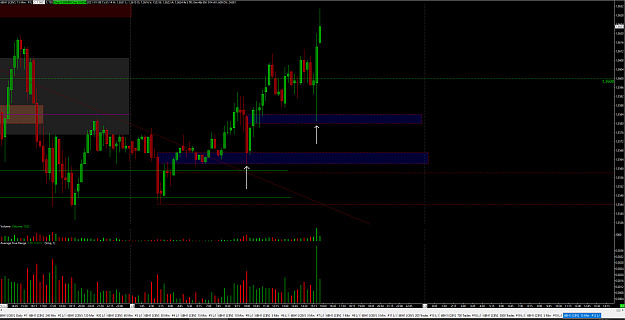
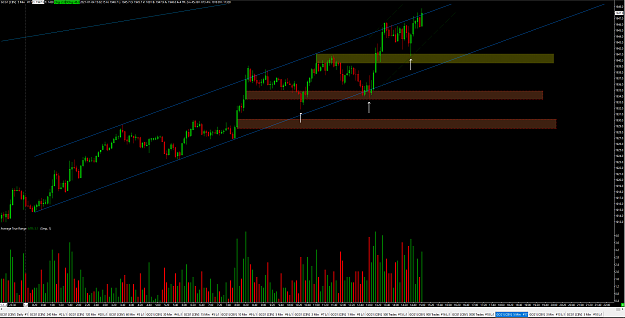
- freemind replied Jan 5, 2021
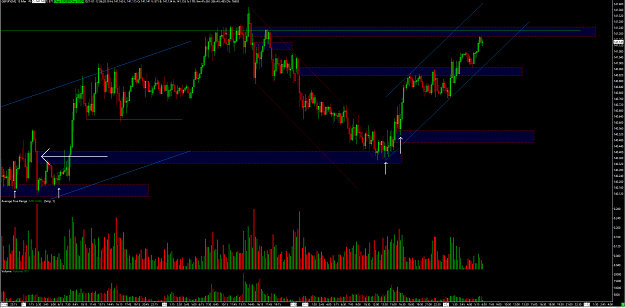
as often it is seen after good moving days comes choppy days. still, PA gave several entries, though some of them while i was sleeping. blue zones are 15m and other ones are 5m, i prefer to use multiple TF, as it gives/shows a better picture.
(binned per thread starter’s request) Supply and Demand, Price
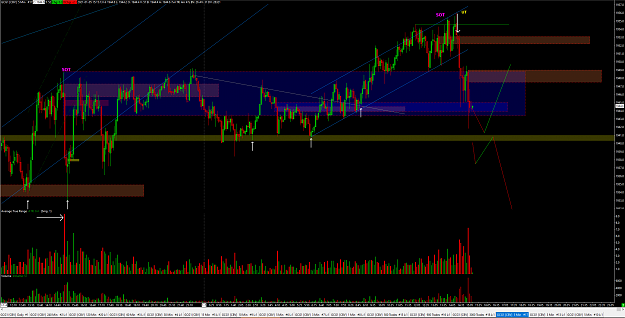
- freemind replied Jan 4, 2021
gold chart based on WRB concepts presented by Winston. at the bottom thats just ATR of 1 not volume, so its easier to spot WRB. we are now at 4h supply zone and round number, so potential weakness may be visible.
(binned per thread starter’s request) Supply and Demand, Price
- freemind replied Jan 2, 2021
thx for the video, I highly appreciate that (and I'm sure others as well)! Great points of explaining confirmation and what you look for when entering a trade. the question was because the zone could end as a very big one if we have a coil and then ...
(binned per thread starter’s request) Supply and Demand, Price