- Search Energy EXCH
- 54 Results (3 Threads , 51 Replies )
-
 forrestang replied Apr 8, 2023
Howdy. I too went down a similar route as Apprendista a while back. Admittedly, I will have no real answers, so I will just post some observations I have had. Everyone knows what the basic signal is, so I won’t belabor that point. But just a general ...
Higher Edge within a Single Candlestick
- forrestang replied Feb 16, 2023
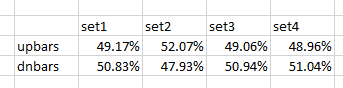
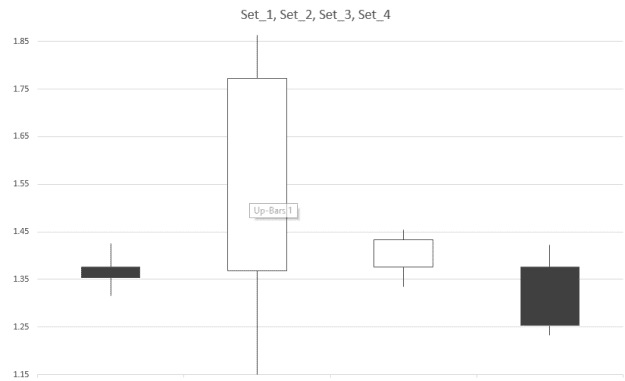
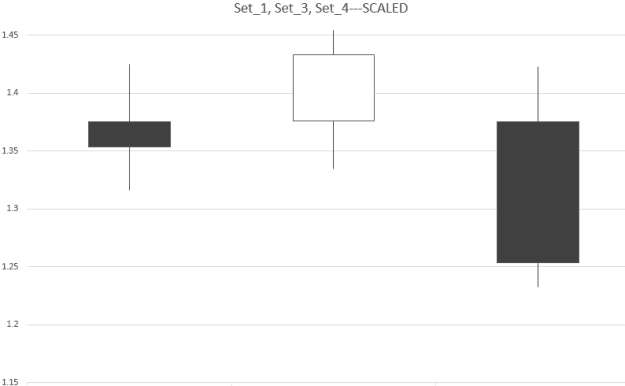
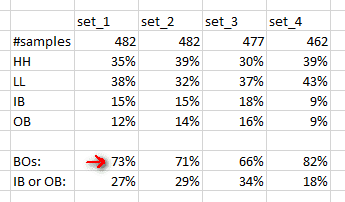
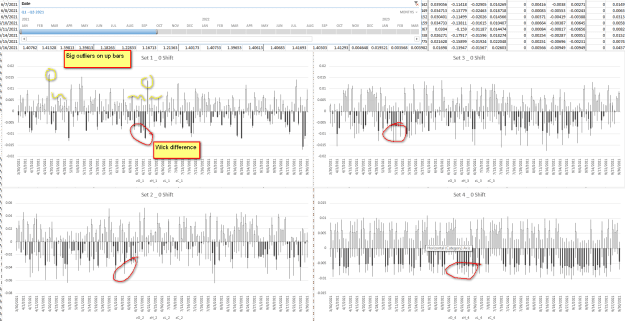
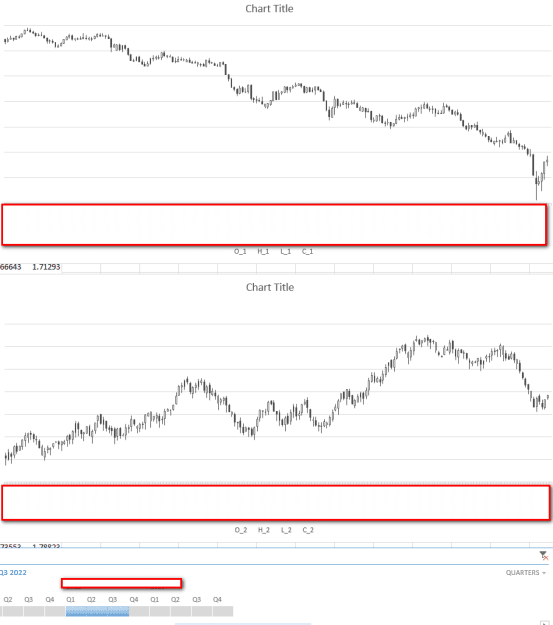
Post 2/2 Continued... Up vs Down bars. Pretty simple. image Path Walked, for each data set. Below is an example of each data set, constructed into a candle. I.e., imagine those images above showing the candle stick charts(first image I posted), ...
Trading Logic and Market Constants
- forrestang replied Feb 16, 2023
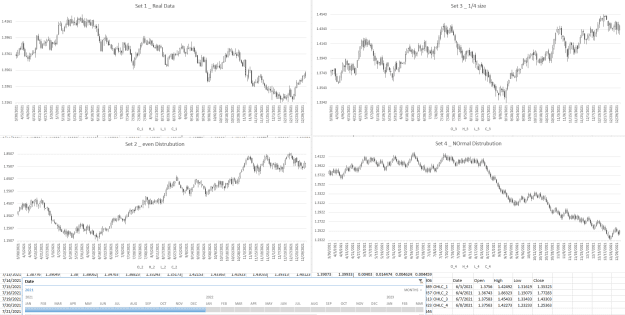
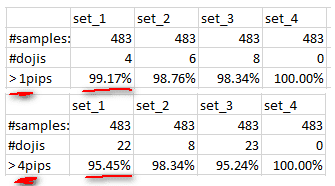
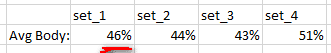
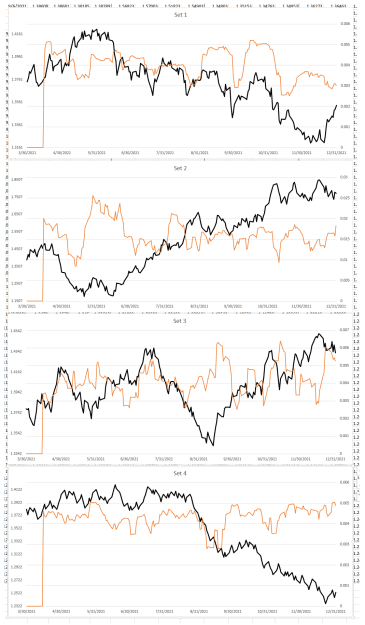
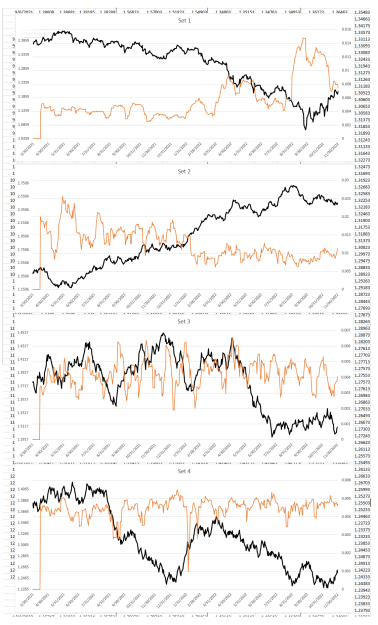
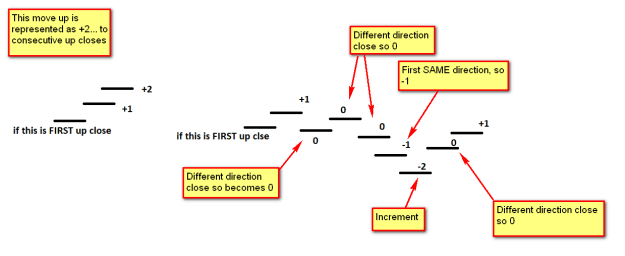
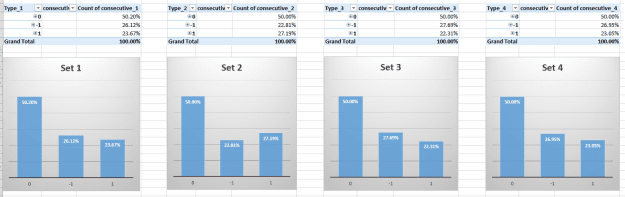
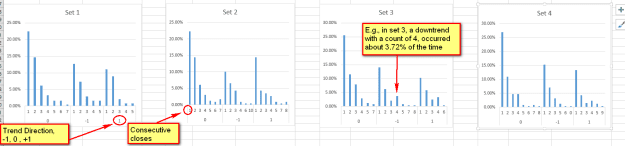
First post about it, just includes some basic data. HOW THE BARS WERE CREATED There are probably much more sophisticated ways to create random price data, but I’ll offer a general explanation of the 3 types of data I generated. Each data type will ...
Trading Logic and Market Constants
- forrestang replied Feb 11, 2023
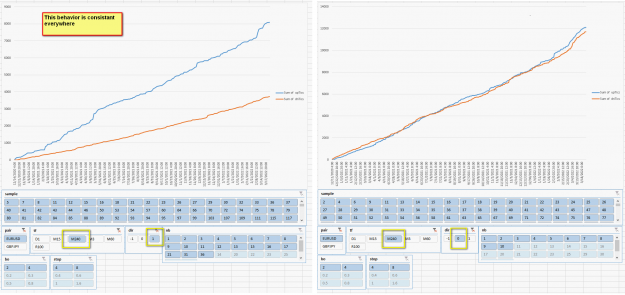
I will post some other data when I finish compiling it. But I generated some random data along side of Daily Data taken from the G/U. I created 3 sets of different random data, all generally based on the original set of data in some way. I just did ...
Trading Logic and Market Constants
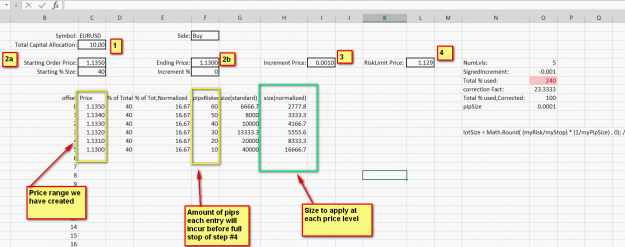
- forrestang replied Jun 21, 2022
I completely forgot I posted this thread here. I was using babypips for examples, but the examples there didn't help me figure it out. I was unable to really translate the babypips examples into the information I needed. But I did eventually figure ...
Having a brain fart on figuring out margin used based on stop?
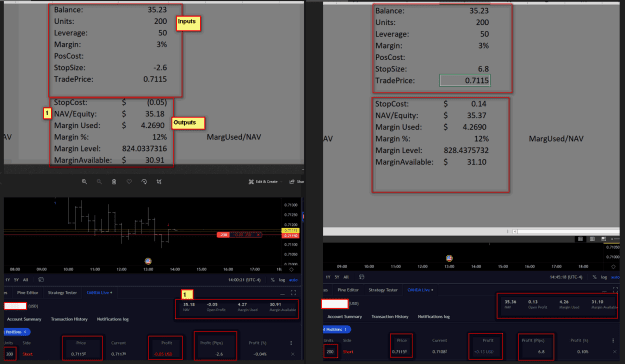
- forrestang replied Apr 3, 2022
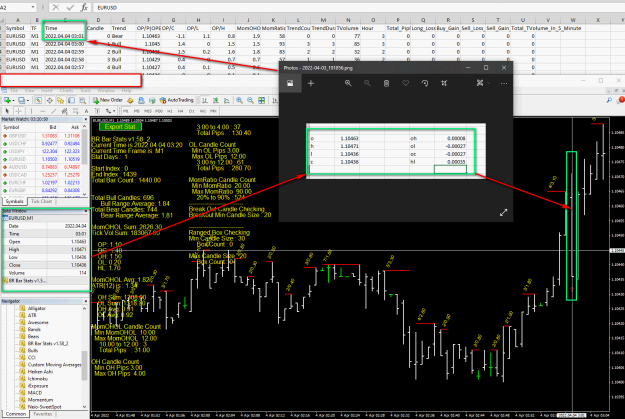
Am I misreading the output of the indicator? I ran the stats in MT4 with your posted indicator, and outputted to the data to file. However, just looking at the basic columns... I'm not understanding the first several values? I am attaching an image ...
Mind and Machine Scalping system for risk-averse retirees
- forrestang replied Apr 2, 2022
Yes, I will be developing everything for NT(NinjaTrader), as if I ever do have a tool to take trades so that I do not have to do it, I will likely do it through NT, as I can build whatever is necessary given enough time. I'm still going over the ...
Mind and Machine Scalping system for risk-averse retirees
- forrestang replied Apr 1, 2022
Yes, apologies, NT is NinjaTrader. My situation is that I use NT for real time charting purposes. I also use it for building scripts, to EXPORT data from the chart, to play with in Excel. I do not actually place trades in NT, as you cannot trade FX ...
Mind and Machine Scalping system for risk-averse retirees
- forrestang replied Mar 31, 2022
Just found my way here... man I love threads like this. Even if I KNEW it wouldn't help w/my trading, I'd still participate in these data threads. I have read all of the thread, don't understand much, but am enjoying the discussion. Just to derail ...
Mind and Machine Scalping system for risk-averse retirees
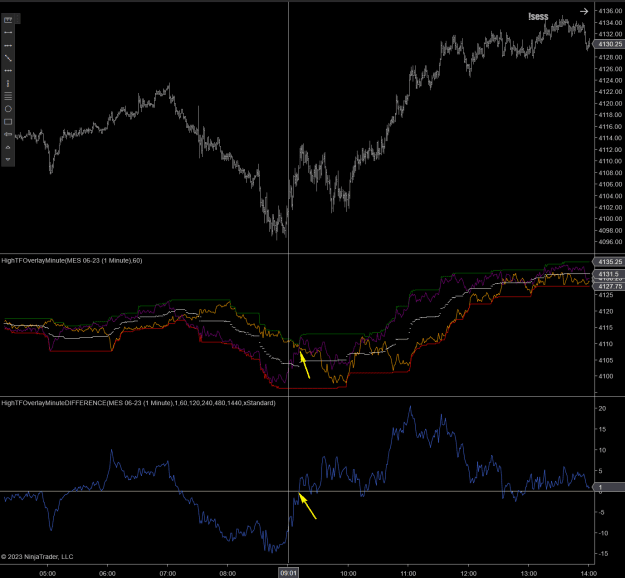
- forrestang replied Dec 20, 2021
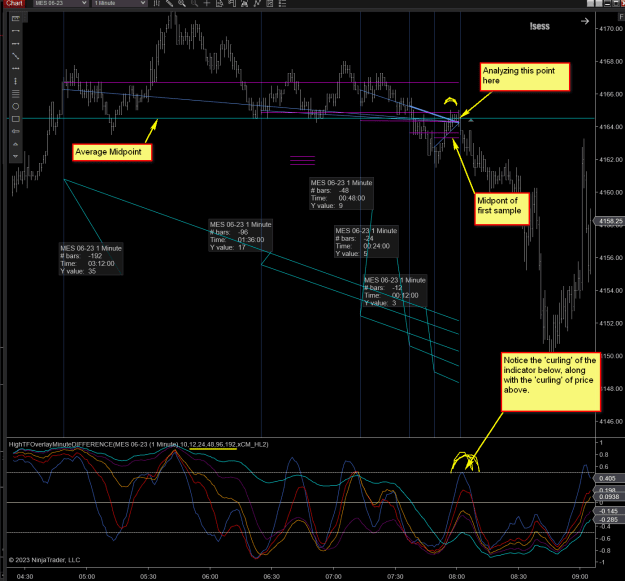
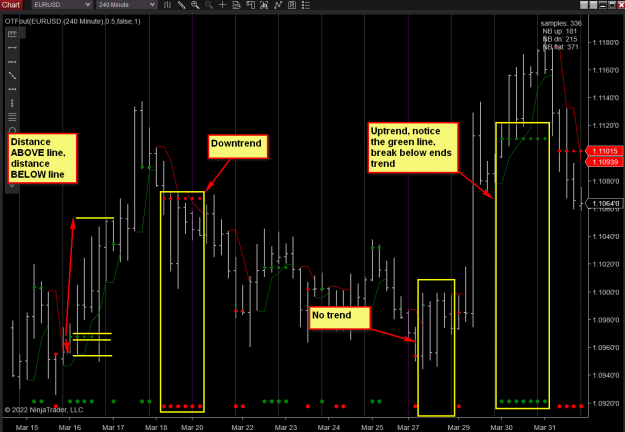
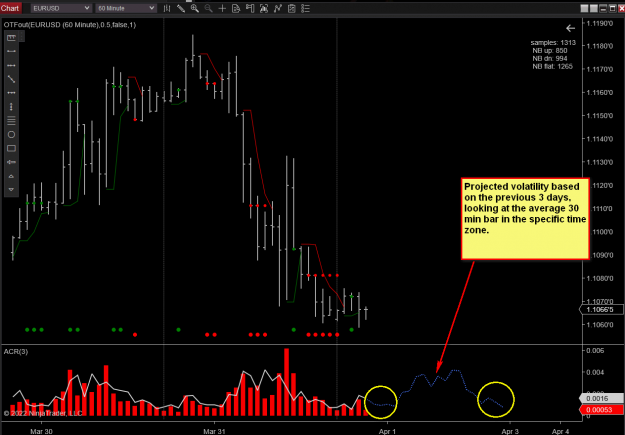
Been watching this for a few weeks. Made some tools also. The chart just shows the plot of weekly/monthly lines(blue/purple). The oscillator in the paing below, is simply a measure of price AWAY from that zone created by the weekly/monthly lines(Red ...
Beating the Odds - Edge Within a Single Candlestick (Explained)
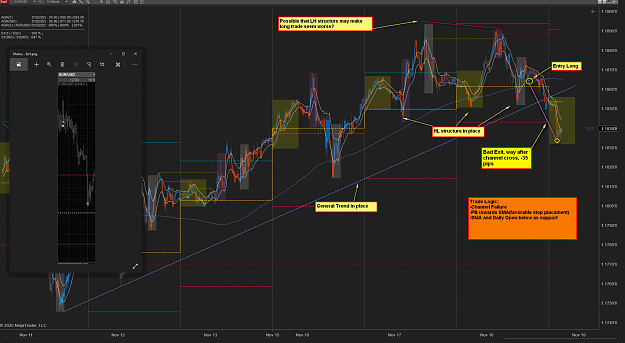
- forrestang replied Nov 19, 2020
Just got finished reading the entire thread, all 102 pages(I have # of posts at max value). A few trades I took overnight. EU Channel Failure(-35 pips). I don't think I did anything wrong here on entry? It seems like just one of those trades. HL ...
Roadmap - A Way To Read Markets
- forrestang replied Jul 21, 2020
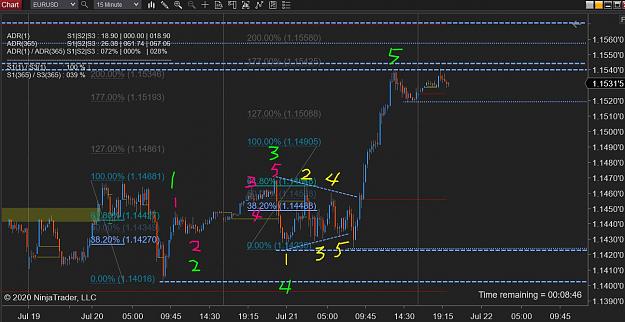
Somewhat similar to the example in the book, except this was a converging triangle(book was ascending), even had the fakeout on the bottom side of it. Real time I was able to trade both 5 wave moves in pink(short), and a long near that yellow #1(it ...
Price action at the core = family members' discussion project
- forrestang replied Jul 18, 2020
I've found through my studies that this is true.
Price action at the core = family members' discussion project
- forrestang replied Jul 14, 2020
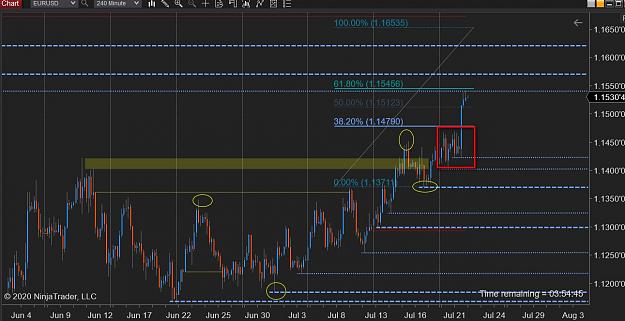
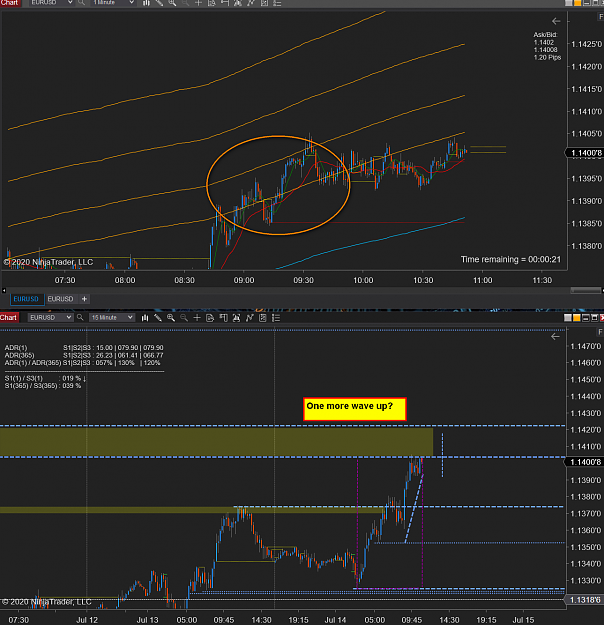
Typically I would have already gone short at some point around here(circle)... But waiting to see if there is at least one more wave up to finish off this current cycle on EU(bigger chart).
Price action at the core = family members' discussion project
- forrestang replied May 18, 2020
Wider view... Are you talking about those two down below?
Real or Algo
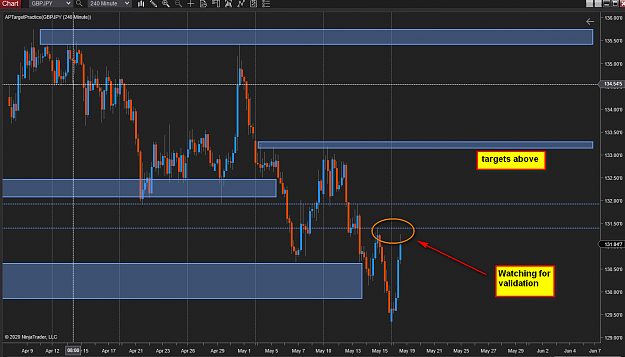
- forrestang replied May 18, 2020
Clear targets above, potential validation in play now, but we'll wait to see.
Real or Algo
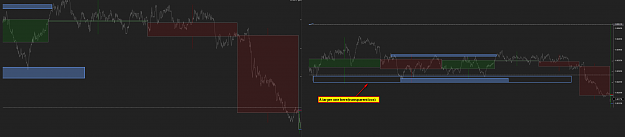
- forrestang replied Apr 28, 2020
We did drop, interestingly enough zooming out, the image on the right shows a larger overlapping area that may have been a target also.
Real or Algo
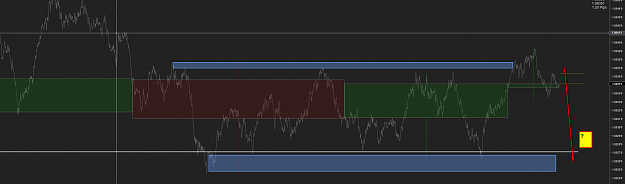
- forrestang replied Apr 28, 2020
A 3-tic chart for fun, wonder if this has a higher likelihood of reaching the bottom target than moving through the top target?
Real or Algo
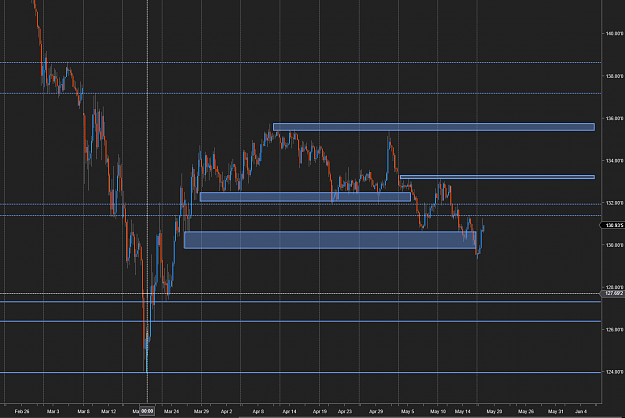
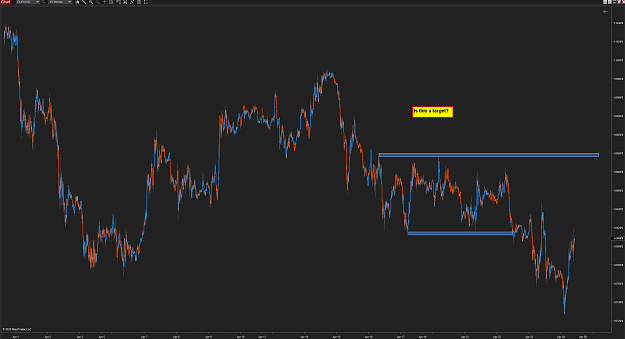
- forrestang replied Apr 24, 2020
Still getting up to speed, but is does this top area look like a legit target?
Real or Algo
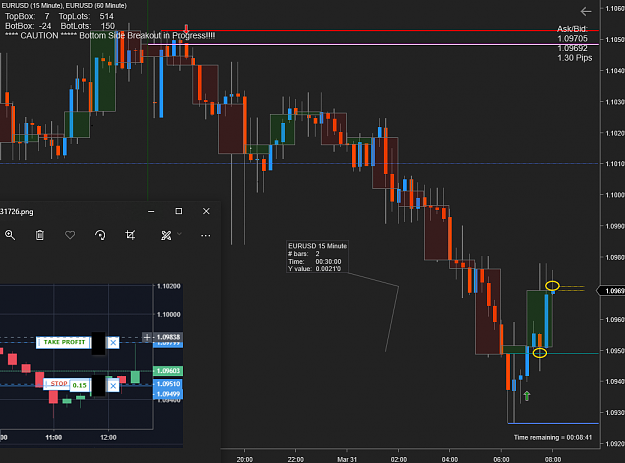
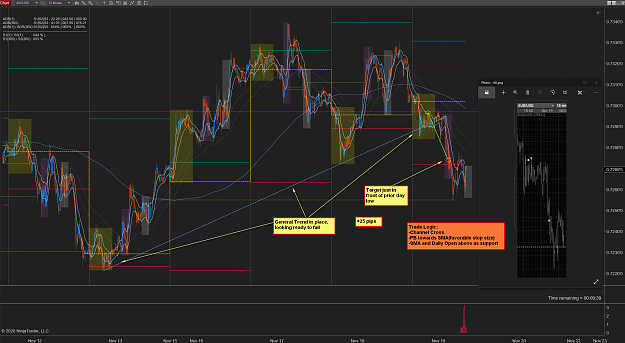
- forrestang replied Mar 31, 2020
After missing two trades yesterday(mainly just due to fumbling with getting set up), but got one today. Trade 1: +20 pips, Noticed price dropped below the Prior Day's Low, but still took a trade. Working with limit orders as price breaks an open I ...
Highest Open / Lowest Open Trade