- Search Energy EXCH
- 15 Results
-
 fintrans replied Jan 21, 2011
Sure. Here's one: url .
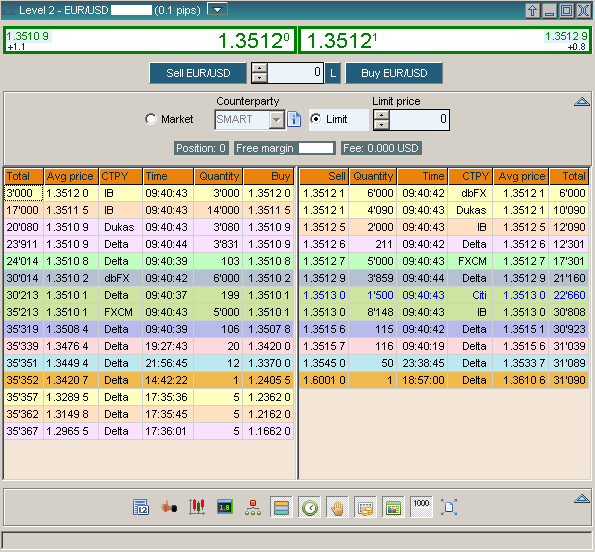
Other than MBT, IB, and Duka, where can I see level 2 data?
- fintrans replied Mar 17, 2008
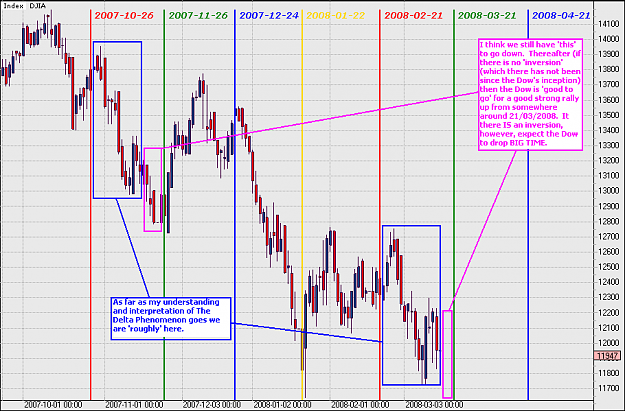
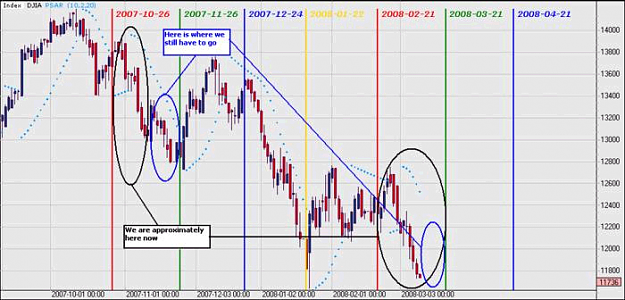
Just for interest sake I thought I'd attach a current chart of the Dow with 'basic' Delta plotted. 'Uncanny' is the only word that comes to mind!!! (For a 'larger' and much 'clearer' 'full size view' download this file if you like): url (This ...
Delta Phenomenon
- fintrans replied Jul 27, 2007
For ONCE - I was right!!!
Profitunity (Chaos) Trading System by Bill Williams
- fintrans replied Jul 20, 2007
Hey isto - thanks for the input - I'll respond later. For now - check out the chart for AUD/USD (and I hope it does not turn out like my last trade on USD/CAD - I eventually closed it out today for a $5.00 profit after a week! I made more in an hour ...
Profitunity (Chaos) Trading System by Bill Williams
- fintrans replied Jul 19, 2007
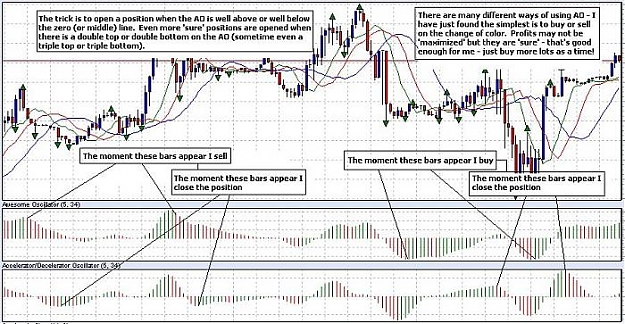
Well as promised (to isto) here is what I have found works for me: I have found that working on the 15 minute and longer timeframes using ONLY AO and AC I am making far more consistent profits than I ever have using the system as a whole as detailed ...
Profitunity (Chaos) Trading System by Bill Williams
- fintrans replied Jun 26, 2007
Hey isto, Hello again. Like I said - it finally arrived!!! Anyway (before I start reading) I have a question for you i.e. what would you do do you think? This morning I placed a sell stop order for USD/NOK on the 4 hour chart. I always use the value ...
Profitunity (Chaos) Trading System by Bill Williams


- fintrans replied Jun 26, 2007
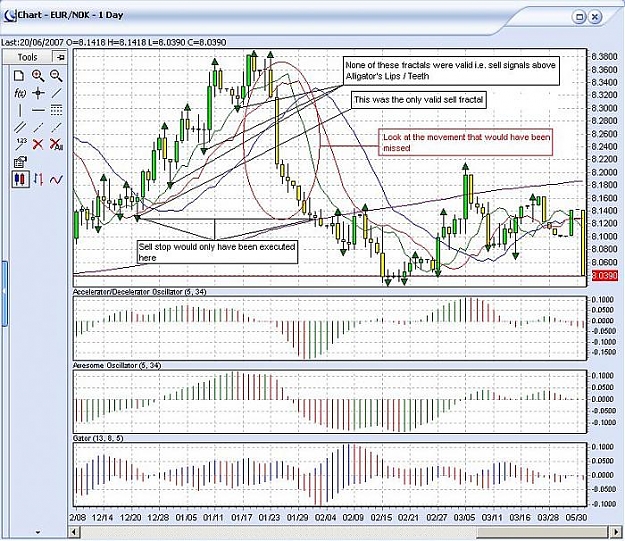
Hey isto, how's it going? I have been studying various daily charts and I keep finding that by placing orders only when 'valid' fractals appear you miss out on a lot of very good trades. Just have a look at my chart (EUR/NOK Daily). You may have ...
Profitunity (Chaos) Trading System by Bill Williams
- fintrans replied Jun 22, 2007
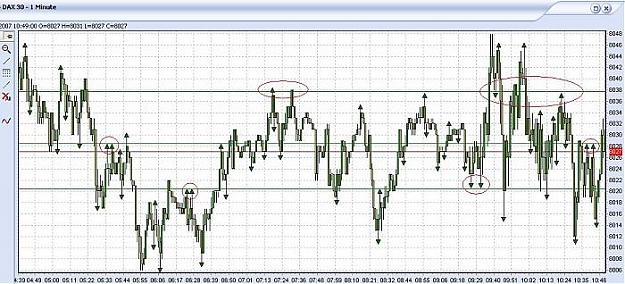
Here you are (I hope this works as I had to 'squeeze' and 'stretch' the chart to make it fit in the allowed dimensions). What do you think? You could use it by placing orders either buy or sell one or two ticks above or below the lines. Regards, ...
Profitunity (Chaos) Trading System by Bill Williams
- fintrans replied Jun 20, 2007
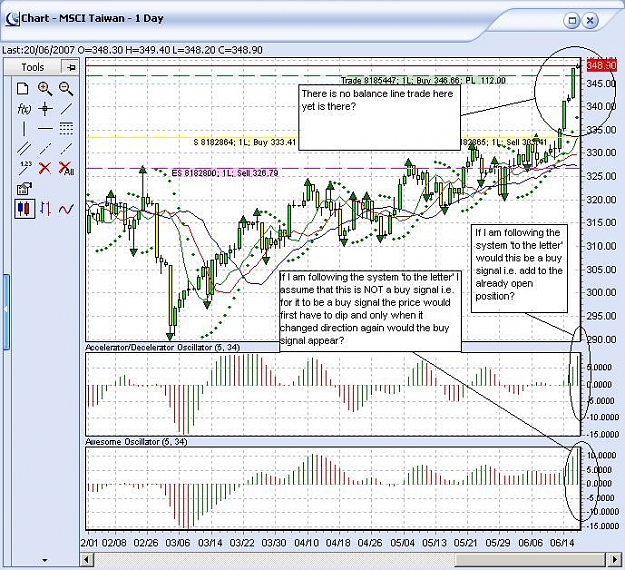
Hye isto, Good Morning! Listen - I want to try and start adding to already open (and profitable) positions based on AO, AC, and Balance Lines. I have attached a daily chart of the MSCI Taiwan. The graph has just updated i.e. new day. Please check me ...
Profitunity (Chaos) Trading System by Bill Williams
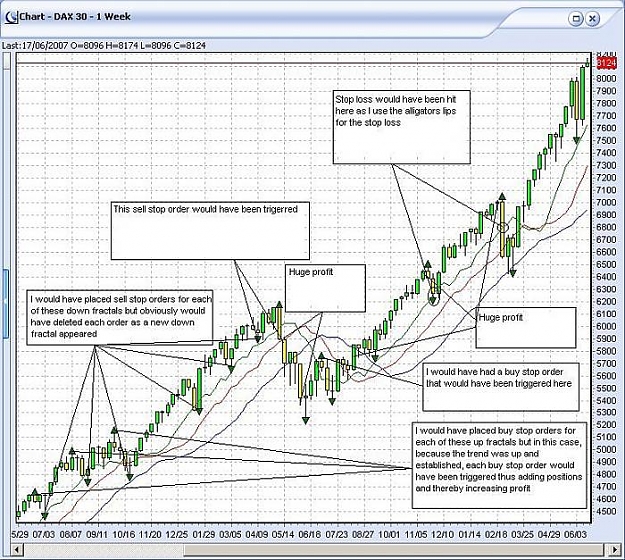
- fintrans replied Jun 19, 2007
Hello, OK - I have attached another chart as requested - with details as to where I would have placed my orders and stop loss. The only problem with this system (is it a problem - I don't know) is that you can wait for a long long time to get the ...
Profitunity (Chaos) Trading System by Bill Williams
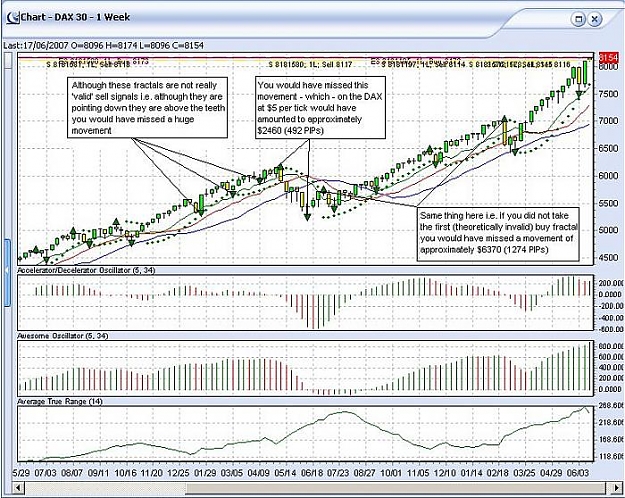
- fintrans replied Jun 19, 2007
Hello everyone (and isto), isto - you asked if anyone had any input with regard to false signals. Well - here is my trillion dollars worth: I started using this system last Monday (after I had had a hard time trying to understand the fractal ...
Profitunity (Chaos) Trading System by Bill Williams
- fintrans replied Jun 9, 2007
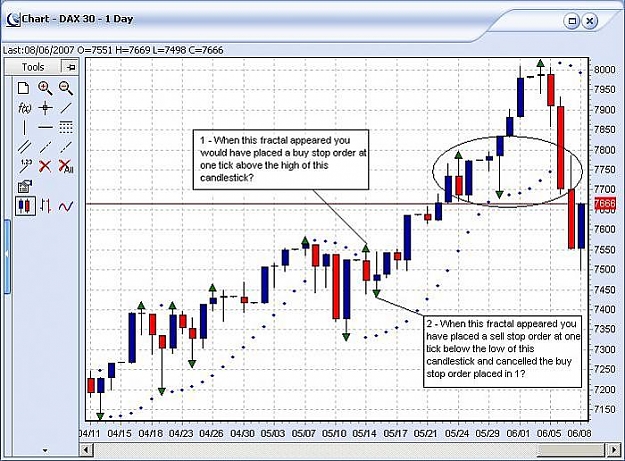
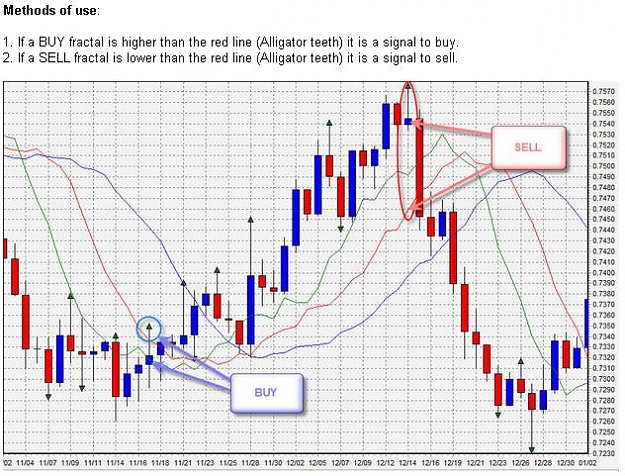
OK - I think I've got it (finally): If I understand this correctly: When an up fractal appears you would place a buy stop one tick above the value of the high of the candlestick or bar to which the fractal is attached AND when a down fractal appears ...
Profitunity (Chaos) Trading System by Bill Williams
- fintrans replied Jun 8, 2007
OK - now a new fractal has appeared - pointing up. What is this telling me to do? I know these things are supposed to be used in conjunction with AO and AC BUT for now I need to understand the most basic element WHICH IS THE FRACTALS for crying out ...
Profitunity (Chaos) Trading System by Bill Williams

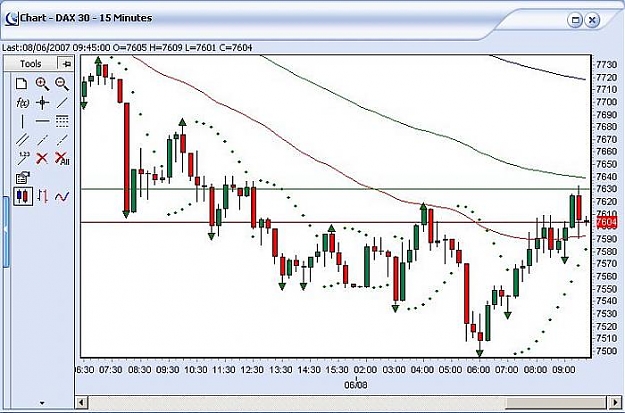
- fintrans replied Jun 8, 2007
Nah - you've still got me! OK - to put it into perspective I have attached another (live) chart. Based on the fractals being displayed what would you be doing? This may help me understand (the other chart like I said was just from the online help ...
Profitunity (Chaos) Trading System by Bill Williams
- fintrans replied Jun 8, 2007
Hi, I'm sorry to worry you guys with this question and it may be a silly question at this late stage of the game BUT I have been looking at this system and read it and reread it and reread it and I have read my charts manual AND I JUST DON'T GET THE ...
Profitunity (Chaos) Trading System by Bill Williams
- Posts by Member Search: 'fintrans'