- Search Energy EXCH
- 123 Results
-
 elitejets replied Aug 24, 2011
cable hourly — Not sure about cable
Igrok Method. Q's & A's. Comments, thoughts and ideas
- elitejets replied Jul 31, 2011
E-mini S&P — ES daily chart
Igrok Method. Q's & A's. Comments, thoughts and ideas
- elitejets replied Aug 27, 2010
Hi Belekas, Hi guys. Daily S&P chart, do you think this might be a possibility?
Igrok Method. Q's & A's. Comments, thoughts and ideas
- elitejets replied Jun 24, 2010
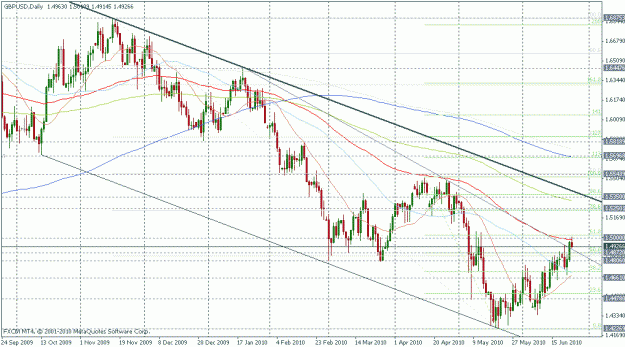
Cable — Yes, me. Having said that it is a concern that cable has gone sideways while other currencies have fallen, showing strength. Cable might be heading for this higher trendline (that I have made thicker in this chart) and 1.5250
Strat's Long Term Stress Free Trading
- elitejets replied Jun 24, 2010
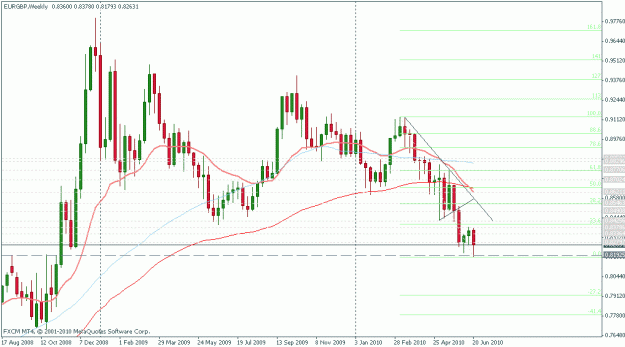
EURGBP — EURGBP has bounced off a big weekly support level. I am waiting for price action at 85.00 or 85.50 to sell it again but I would not be surprised to see it run up to 87.70
Strat's Long Term Stress Free Trading
- elitejets replied Jun 18, 2010
NZDJPY — NZD weakest currency today, JPY strongest. 1hr chart
Igrok Method. Q's & A's. Comments, thoughts and ideas
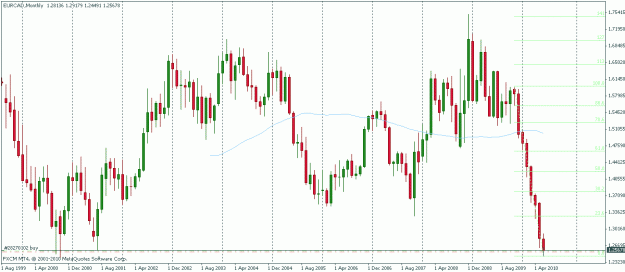
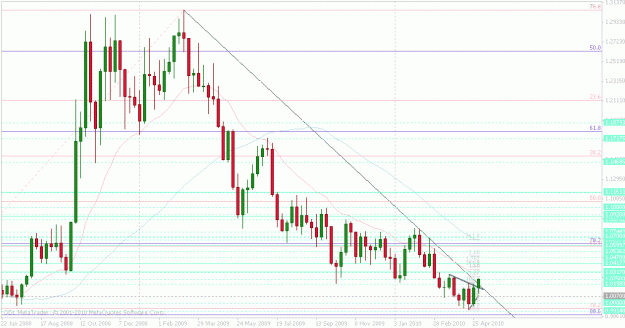
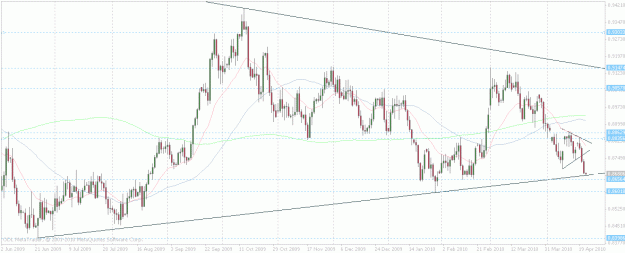
- elitejets replied Jun 14, 2010
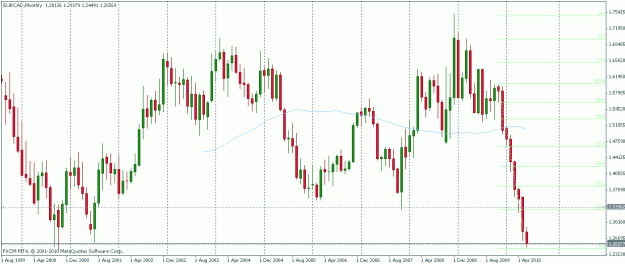
EURCAD — Monthly chart. We are at "the" level. Now we need the price action. Great risk:reward if we get it.
Strat's Long Term Stress Free Trading
- elitejets replied Jun 14, 2010
EURCAD — Monthly chart ... This is a big level, a reversal here could present good risk:reward. The last two swings down on the daily chart were equal as in AB=CD Great thread guys!!
600 Pips a Month with Shahab and GeppyG
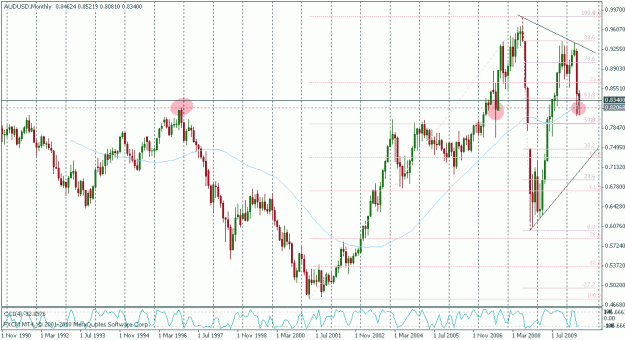
- elitejets replied Jun 10, 2010
AUDUSD — Monthly chart - big level Daily chart, triple bottom ... one to watch. I am looking for a rally to 0.8730 and then price action to short again
Strat's Long Term Stress Free Trading
- elitejets replied Jun 10, 2010
EURUSD — Firstly sorry I have been gone so long. Wasn't so well, better now. This is what Strat calls a buy signal ... last weeks cover
Strat's Long Term Stress Free Trading


- elitejets replied May 14, 2010
Nice call on Gold! I took silver myself and got stopped out and endured some pain before it worked. A good lesson in perseverance for me. Here is my silver chart from Wednesday and reasons for shorting. Now that we have a daily reversal candle I ...
Weekly COT report Analysis + Trade Ideas
- elitejets replied May 7, 2010
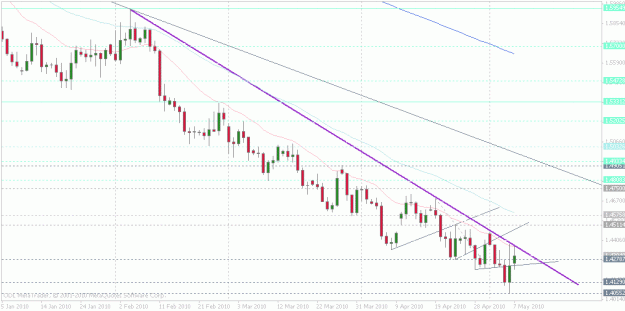
This is a countertrend long below the 20ema in a strong downtrend. It is pretty high risk and not a Strat recommended trade. The thick purple trend-line on the attached chart needs to break for your trade to keep working. I am not tempted to buy ...
Strat's Long Term Stress Free Trading
- elitejets replied May 4, 2010
Weekly trendline breaks AUDUSD USDCAD — If you read back through the thread you will see that Strat believes these pairs are leaders and others are followers. The weekly candles still have to close below/above the trendlines but there are some ...
Strat's Long Term Stress Free Trading
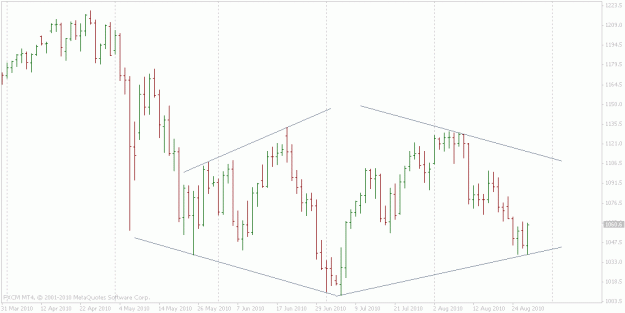
- elitejets replied May 3, 2010
SPX — Hi Guys 4hr S&P futures chart
Igrok Method. Q's & A's. Comments, thoughts and ideas
- elitejets replied Apr 21, 2010
EURGBP daily — Zoomed out ...
Igrok Method. Q's & A's. Comments, thoughts and ideas
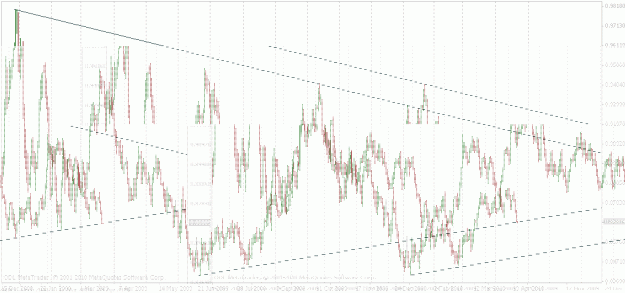
- elitejets replied Apr 21, 2010
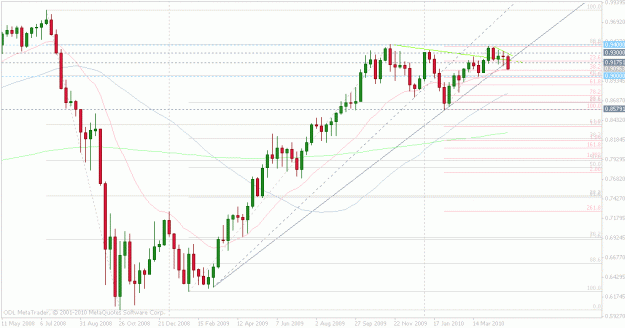
Possible Wedge Breakout EURGBP? — Traditional technical analysis for a wedge (as taught by Strat at the beginning of the thread) says you take the high at the start of the wedge (Dec08 - 0.9802) to the low of the first swing (June09 - 0.8399) ...
Strat's Long Term Stress Free Trading
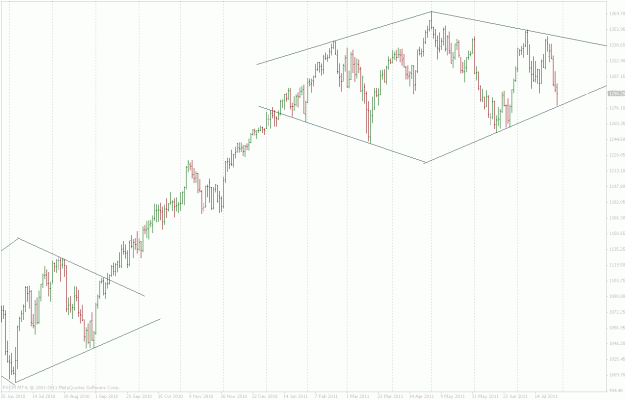
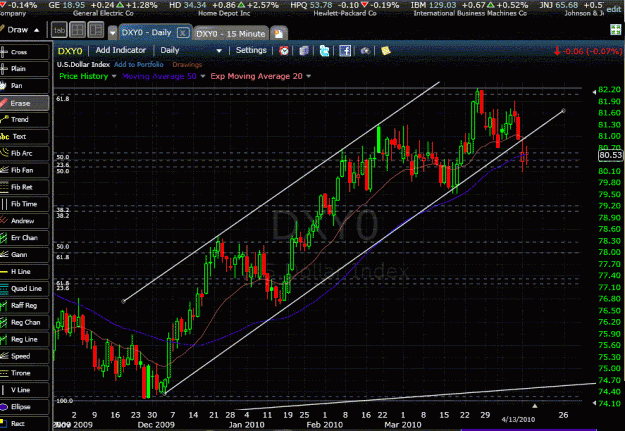
- elitejets replied Apr 14, 2010
Opportunities — They don't call it Turnaround Tuesday for nothing. Here is the dollar index, daily chart. It has fallen out of an ascending channel it has been in since last December indicating that further dollar weakness is underway. So we ...
Strat's Long Term Stress Free Trading
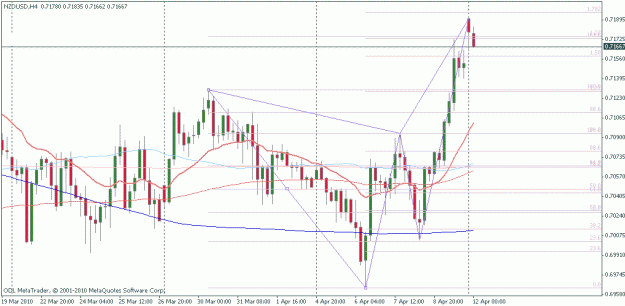
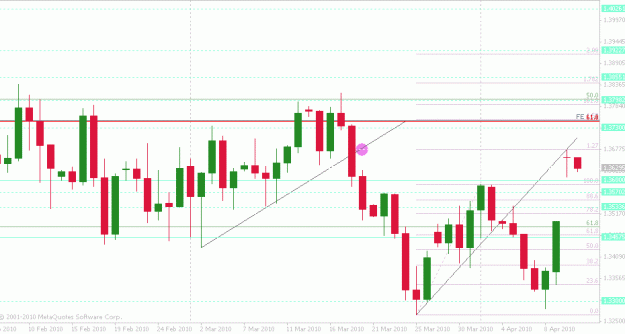
- elitejets replied Apr 11, 2010
EURUSD — Take a look at where price stopped on this gap up tonight. The 127.2 fib is an important fib level and also it has stopped at the level where the price broke the previous trendline support (pink dot). Often price comes back to retest ...
Strat's Long Term Stress Free Trading
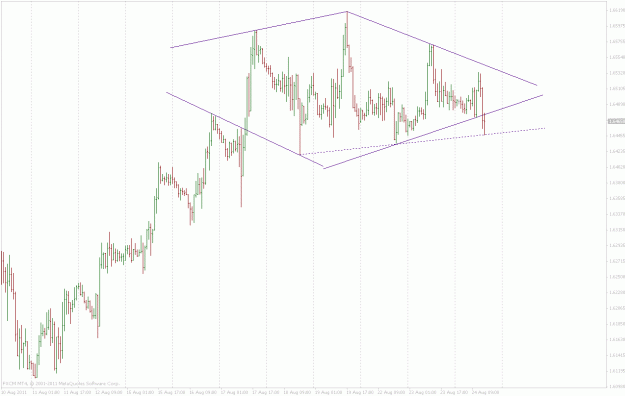
- elitejets replied Apr 11, 2010
Careful with your NZDUSD hellopip, its a pretty bearish pattern called a butterfly. You might want to wait for a deeper pullback to buy.
Weekly COT report Analysis + Trade Ideas