- Search Energy EXCH
- 65 Results
- edmturk replied Feb 5, 2012
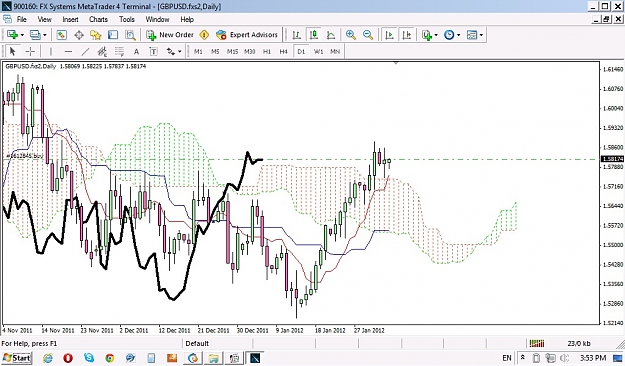
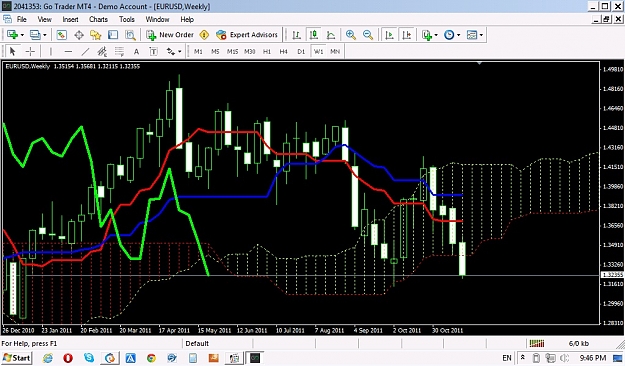
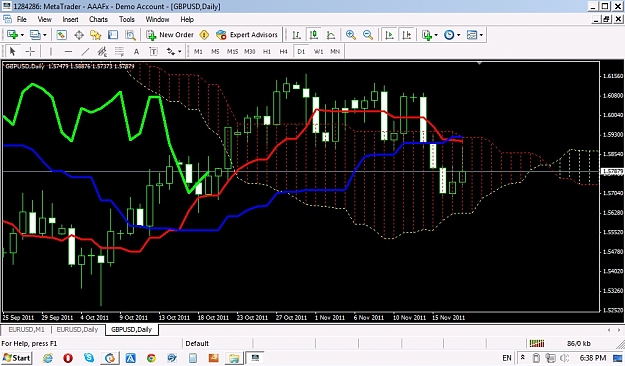
gbp/usd daily — It is bullish in daily chart and since the chiko and the price is above the cloud, and the cloud below is quite thick which creates a good entry point. I have already entered and will be looking to ride it for a while. I am ...
Ichimoku trading journal
- edmturk replied Jan 20, 2012
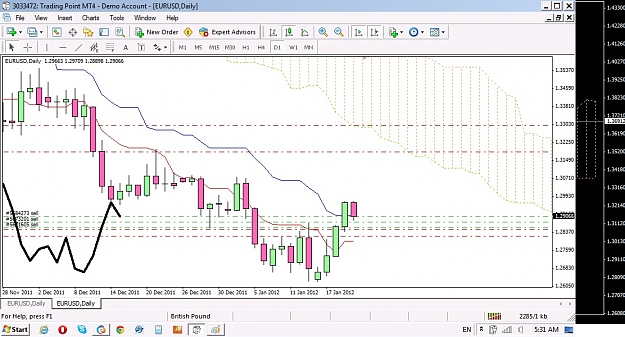
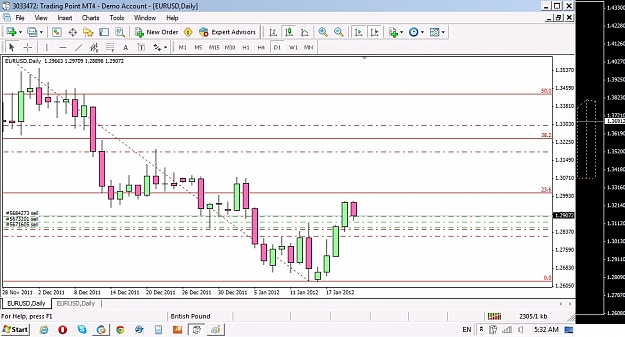
eur/usd — still short on this pair. I am attaching Daily chart with Ichimoku and Fibonacci. Let's wait and see the free fall !!! Pair is still bearish in daily chart.
Ichimoku trading journal
- edmturk replied Dec 9, 2011
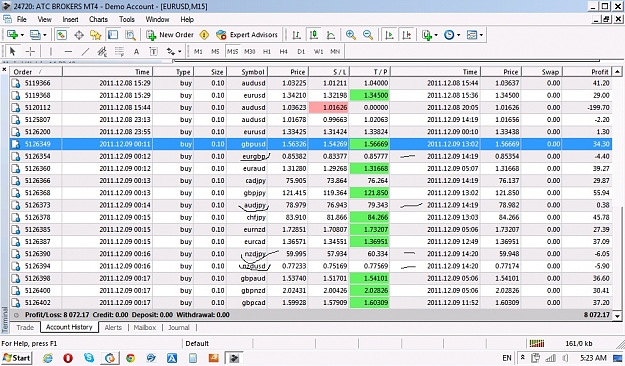
Trial pairs results — Most trades were closed in green and I closed the ones I marked. Impressive
Ichimoku trading journal I am not trading live right now. Only the dated Dec 9 were trial pairs.
- edmturk replied Dec 8, 2011
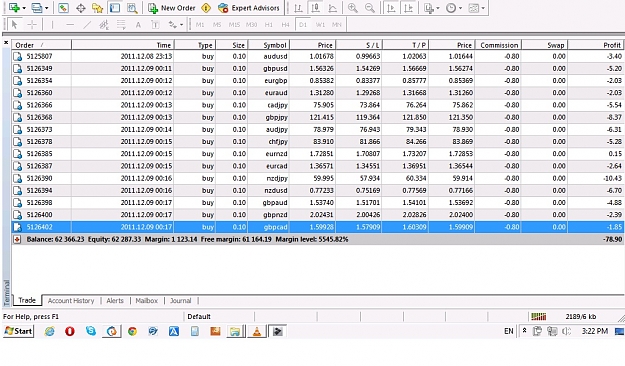
Trial pairs — I am just testing over 20 different pairs just to see how it will behave. This is done on a demo account. I will post the results. I only checked the Daily, Weekly, and Monthly charts and some had conflicts but this is just to ...
Ichimoku trading journal
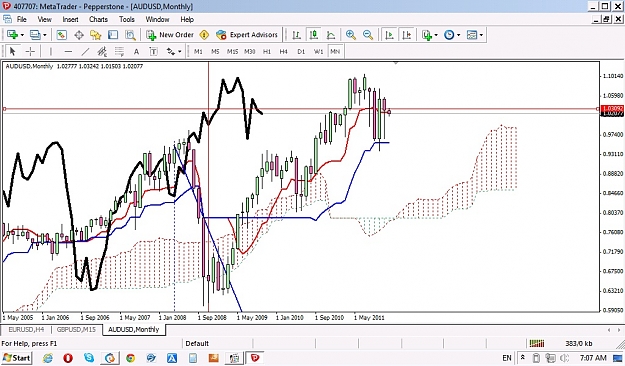
- edmturk replied Dec 6, 2011
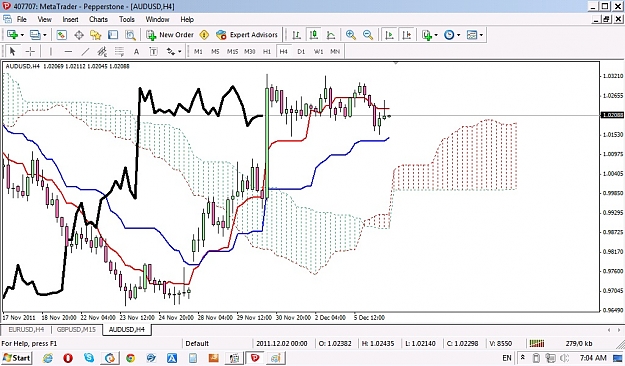
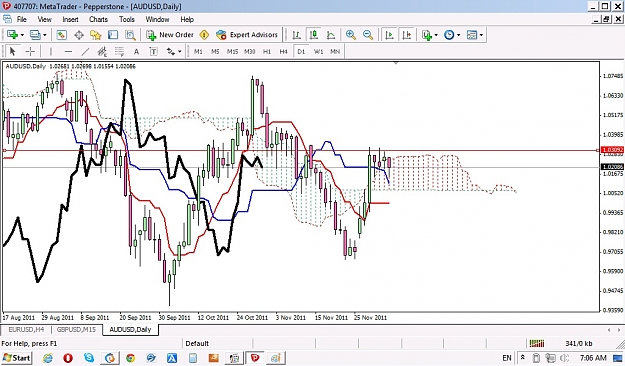
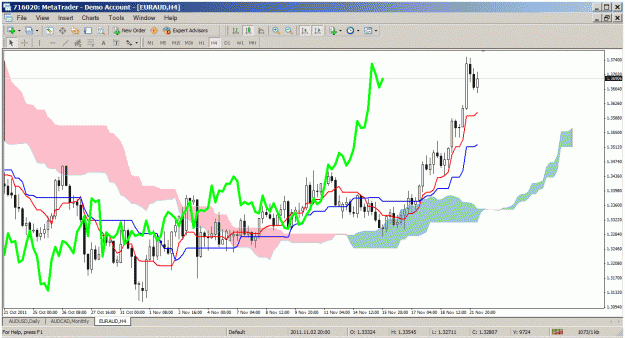
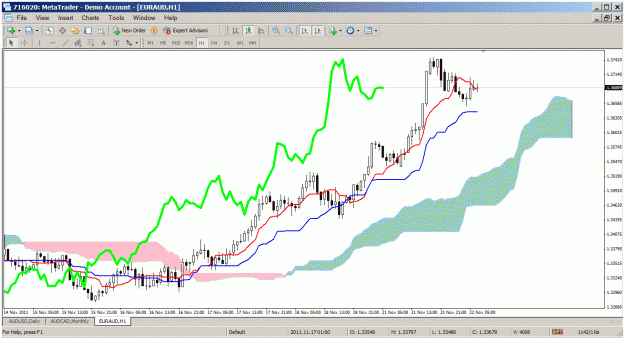
Possible entry on AUD/USD — I put an alert on daily on this pair by around 10309. I am attaching the H4, Daily, and Monthly charts but the price in Weekly chart is still in the cloud. So, before you decide to trade check the higher time frames ...
Ichimoku trading journal
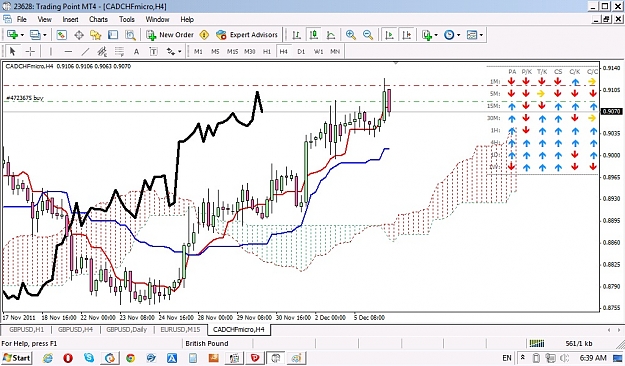
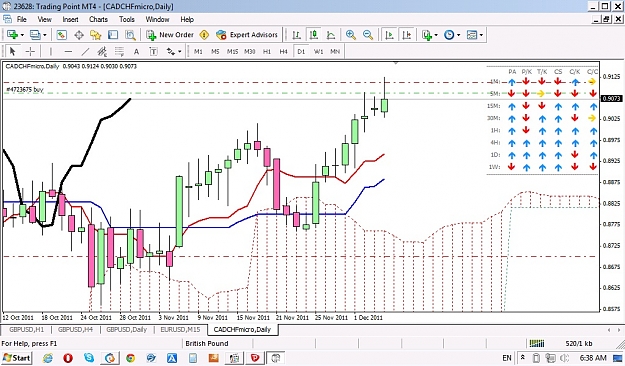
- edmturk replied Dec 6, 2011
Trading opportunity — CAD/CHF on long term is bullish. I entered a small trade and am looking for a longer trade. I am attaching the H4, and Daily charts. Unfortunately, there is conflict in Weekly and Monthly
Ichimoku trading journal I forgot to check the weekly ...
- edmturk replied Dec 4, 2011
gbp/usd — Hi, First of all I need apologize if I caused any misunderstanding. What I meant was I feel your pain of loss since I experienced the same blowing accounts after accounts (am not a good trader yet
Ichimoku trading journal but on the way to improvement). ...
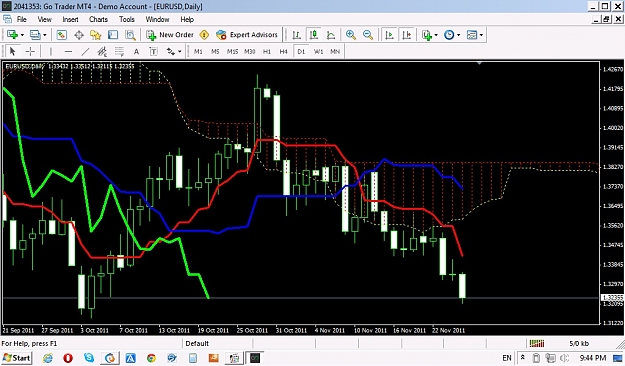
- edmturk replied Dec 3, 2011
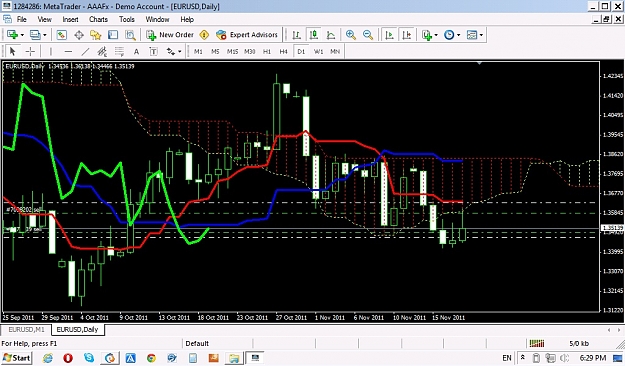
EUR/USD Daily Analysis — Hello everyone, I hope everyone enjoys this thread and enjoy Ichimoku, I am attaching the daily EUR/USD and will do a humble analyses. I have been following this pair quite a bit this week. I put the red line as ...
Ichimoku forever
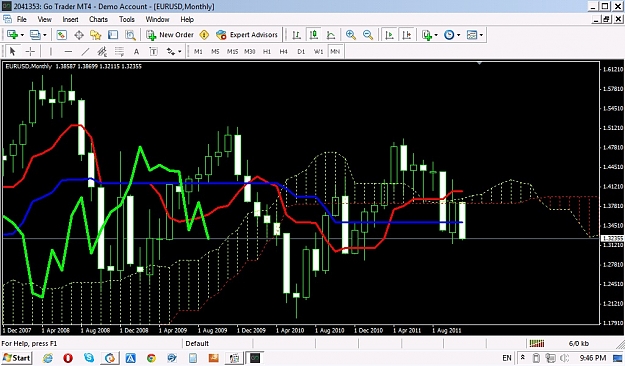
- edmturk replied Nov 26, 2011
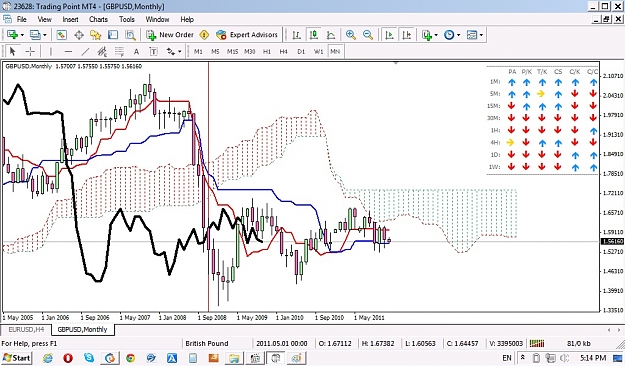
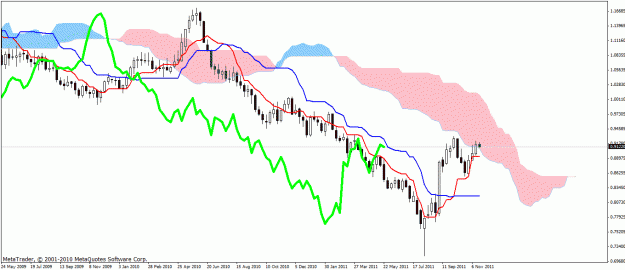
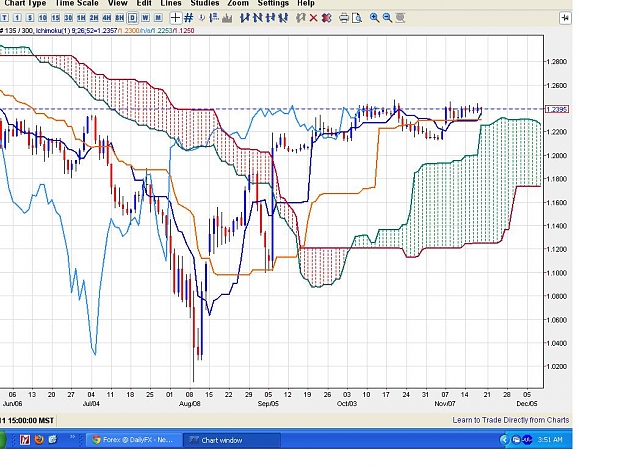
Thoughts on Eur/Usd — Hi everyone, I am trying to deepen my understanding of Ichimoku. I know this pair is bearish on daily chart but the cloud is getting thinner and thinner. I am attaching daily, weekly and monthly eur/usd chart and can you ...
Ichimoku forever
- edmturk replied Nov 22, 2011
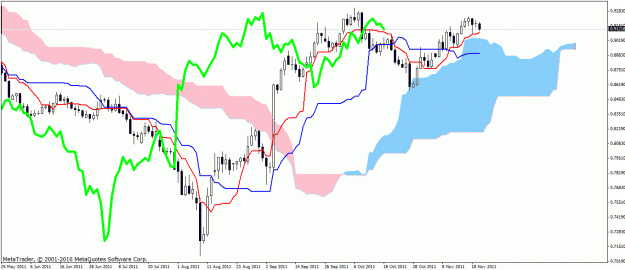
USD/CHF — In daily chart it is still above the cloud. Wait until all ichimoku parts are under the cloud including Chikou before you go short. However, in Weekly chart the price is touching the Senkou A (bearish) so it is at resistance. If I ...
Ichimoku forever
- edmturk replied Nov 22, 2011
Using Ichimoku — You basically check higher time frames (daily, H4, H1) to make sure the direction of the trend (bullish or bearish), then you check smaller time frames. If they all confirm and are on the same direction (daily, H4, H1) you ...
Ichimoku trading journal
- edmturk replied Nov 20, 2011
EUR/CHF Daily — It looks bullish when you look at the Daily and 4H charts.
Ichimoku trading journal
- edmturk replied Nov 18, 2011
GBP/USD Daily Chart — It seems to be consolidating. Price is in the cloud. Even longer time frames do not confirm any reliable trade signals. It seems to be choppy for a while.
Ichimoku trading journal
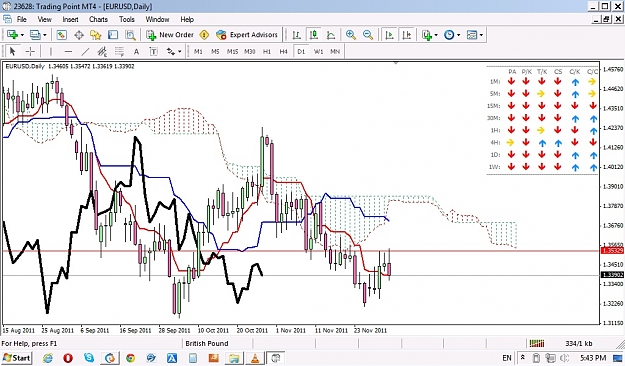
- edmturk replied Nov 18, 2011
EUR/USD Daily Chart — It seems to be bearish. It couldn't break the resistance on Senkou Span A.
Ichimoku trading journal
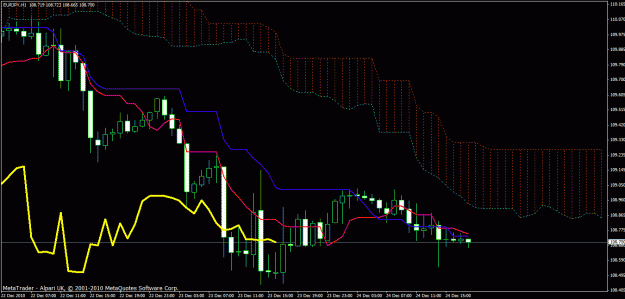
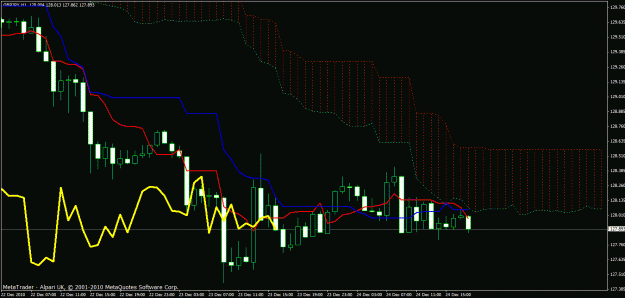
- edmturk replied Dec 25, 2010
GBP/JPY H1 — Bearish/consolidating. Be very careful if you want to trade this time frame.
Ichimoku trading journal
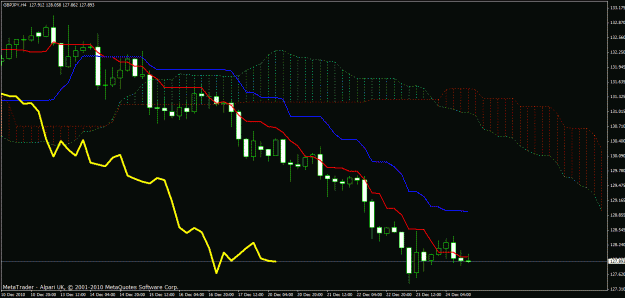
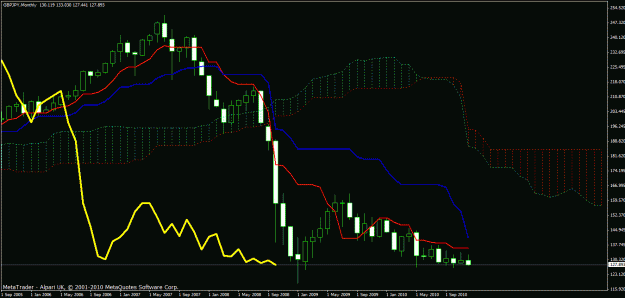
- edmturk replied Dec 25, 2010
GBP/JPY daily — It is bearish but the price is far away from the TS and the future kumo cloud is bullish. So be cautious.
Ichimoku trading journal
- edmturk replied Dec 25, 2010
EUR/JPY H1 — Consolidating/bearish. Trade is not recommended. Price under is under a thick cloud.
Ichimoku trading journal