- Search Energy EXCH
- 21 Results
-
 eastmaels replied Aug 23, 2006
Ok, a trial trade is in place — Hi Labrat, I've put on a test trade in MT4. Depending on the outcome of this trade, I'll try to answer your question..
MT4 trailing stops I've entered the following: Buy Price: 1.2769 Stop Price: 1.2749 [20 pip stop] Trail ...
- eastmaels replied Aug 23, 2006
Hi MrFuture, I'm not sure why you give so much fuss about signing up with a demo account with another broker.
Is MT4 the only one to....
 You said: If you want to get the above, just download MT4 from strategybuilderfx.com (you can try others but I use this broker ...
- eastmaels replied Jul 29, 2006
The "Fib levels" referred to in the vegas 1 Hr tunnel doc is NOT EQUIVALENT to "Fib retracement levels" that are available in MT4. The "Fib levels" are the number of pips from a certain point of reference. Based on my understanding of the the 1 Hr ...
VEGAS 1Hr Tunnel Fibs & MT4 Help please...
- eastmaels replied Jul 28, 2006
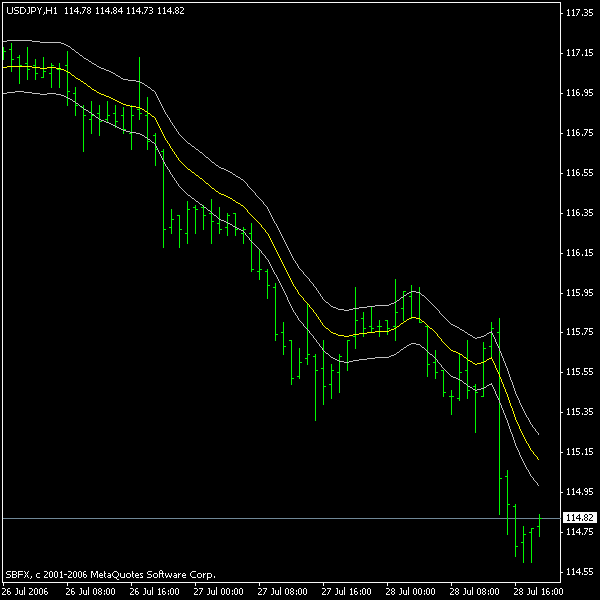
Here's the resulting chart if you followed the above processes correctly. Sorry if my instructions are quite confusing.. But hopefully the images would speak for themselves..
VEGAS 1Hr Tunnel Fibs & MT4 Help please... Hope this helps. East
- eastmaels replied Jul 28, 2006
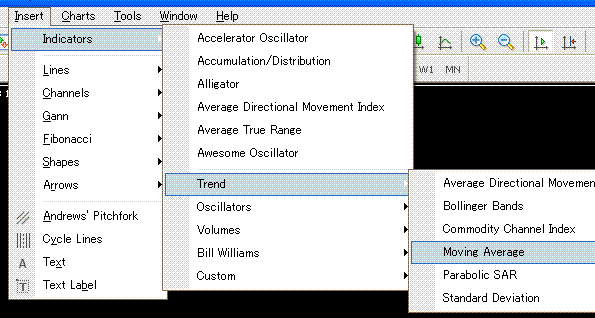
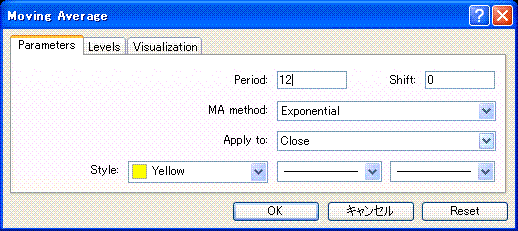
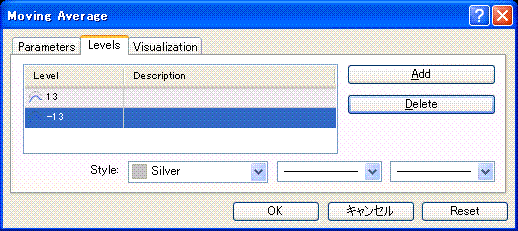
I haven't tried the vegas 1Hr tunnel but hopefully, this is what you're looking for. Here's the walkthrough. 1) First, you'll have to insert the Moving Average that constitutes the tunnel (refer to "Insert MA.GIF") 2) Then, specify the MA period. ...
VEGAS 1Hr Tunnel Fibs & MT4 Help please...
- eastmaels replied Jul 20, 2006
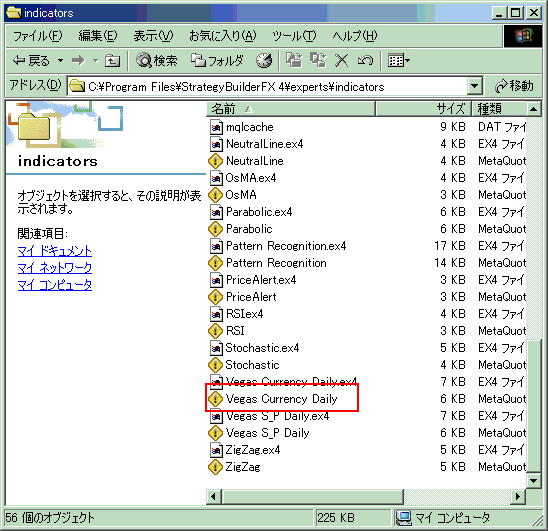
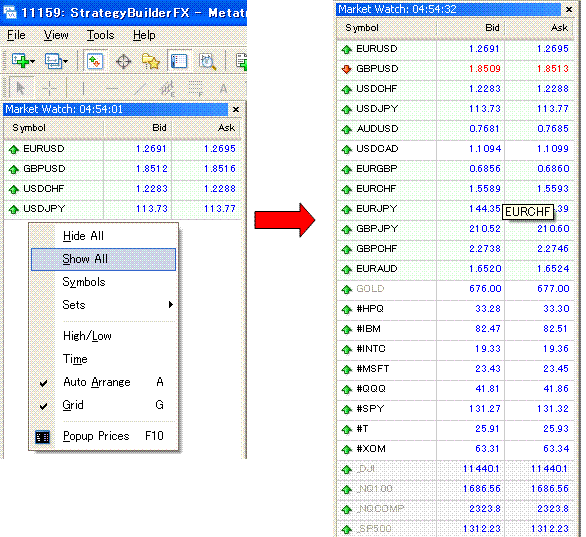
Hi icantoo, Not really sure what's happening so I'll just post images that I hope will help. First, the indicators must be already existing under the "indicators" folder under your MT4 platform (See attached image "indicators folder.gif"). The ...
MT4 Indicators Usage Tutorial/MQL4 Reference Documents
- eastmaels replied Jun 9, 2006
Hi Bemac, Well, based on what I've learned so far, a pin is different from a pin setup. (I'm not sure if I'm getting the words right.. hehe..) A pin is a single bar. A pin setup varies. A pin setup includes the level of the "eyes", the location of ...
james16 Chart Thread

- eastmaels replied Jun 9, 2006
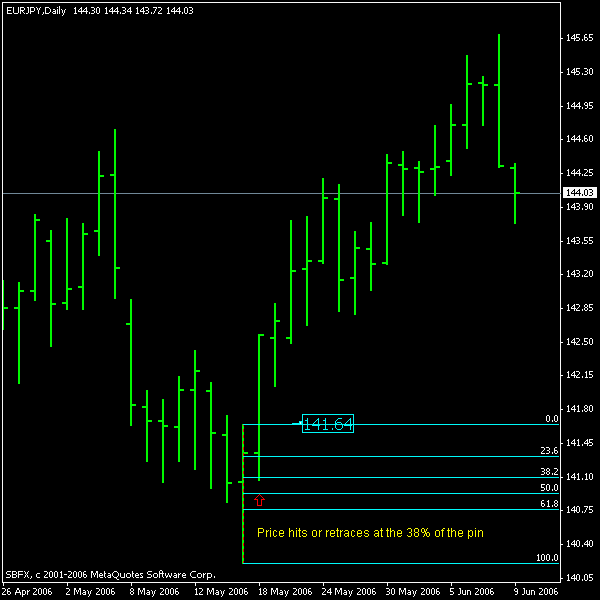
Hi kayoubi, It's already a given for me what kind of person Jim is. But anyway, going to your question. Just my take on this. Waiting for a retracement means waiting for price to hit a retracement level (i.e., on the 38% level) to enter a trade. ...
james16 Chart Thread
- eastmaels replied Jun 2, 2006
Hi clam, Try navigating through MT4. You'll get the hang of it.
Help with using a script in Metatrader Anyway, just to answer, I attached an image. You have to click the button/option that's enclosed in the red box to show the bars as candlesticks. Hope this helps. Regards, East

- eastmaels replied May 15, 2006
Hi migamb, If the price is beyond the fib levels (like the one in the image attached), then you will enter on slope changes. The fib levels are based off the 55 MA. You can also try to attach images though for better understanding.
Metatrader 4 quesiton Not sure if ...

- eastmaels replied May 10, 2006
Hi migamb, Here's my reply: No prob. Anyway, will try to answer your questions. The risk model to apply is dependent on the volatility of a pair. The more volatile the pair, the higher risk model to use. As a general rule of thumb, choose the risk ...
Metatrader 4 quesiton

- eastmaels replied Apr 15, 2006
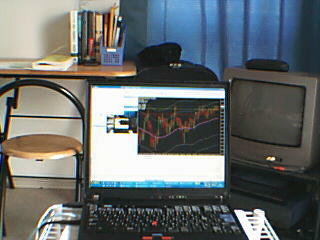
This is not home since I'm currently on assignment by our company here in Japan.... Mannn, I think I'm gonna regret this... Well, but I'm okay with this anyway... So here ya go... See that caged table too? I just assembled that for temporary use so ...
Show your workstation!
- eastmaels replied Apr 4, 2006
Getting Data feed for other markets in MT4 — Here's how you can get data feed for other markets (limited) using MT4: 1) Data feed for other markets are only available (I think) in MT4 downloaded from: ...
MT4 Indicators Usage Tutorial/MQL4 Reference Documents
- eastmaels replied Mar 19, 2006
Hi Tariq, Glad to be of help.
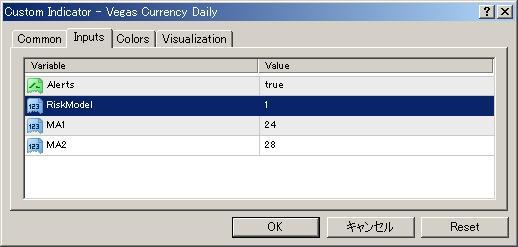
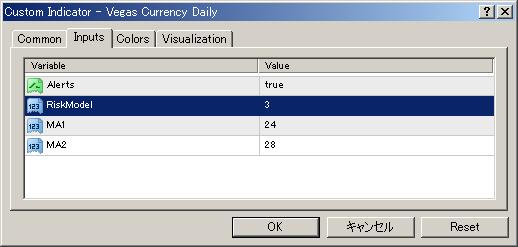
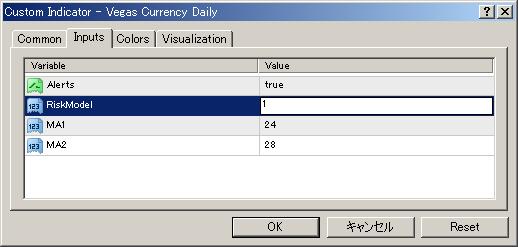
MT4 Indicators Usage Tutorial/MQL4 Reference Documents You can change the model number by double-clicking the number "1" and then change it to whichever model number you want. I've attached an image for reference. Hope this is what you're looking for. Regards, East

- eastmaels replied Mar 3, 2006
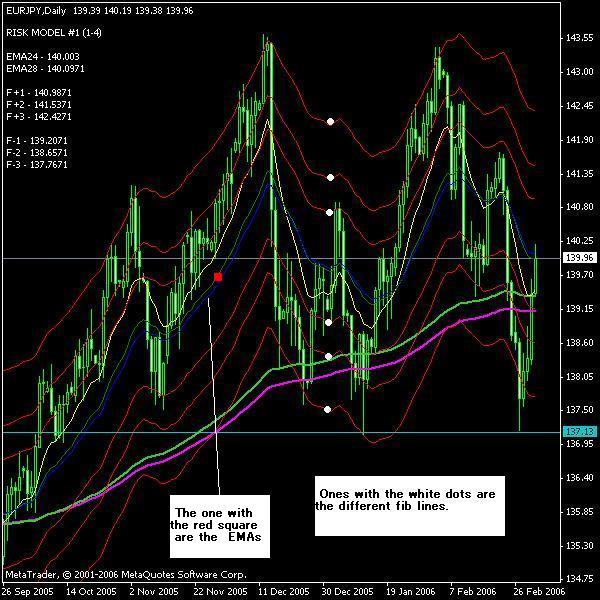
Hope you don't mind me butting in.. As I always do, but the white dots in the image attached are the fib lines or fib levels. They are calculated based on the 28 EMA or 24.. Not sure right now..
'Vegas Wealth Builder Part II' hope this helps, East
- eastmaels replied Feb 28, 2006
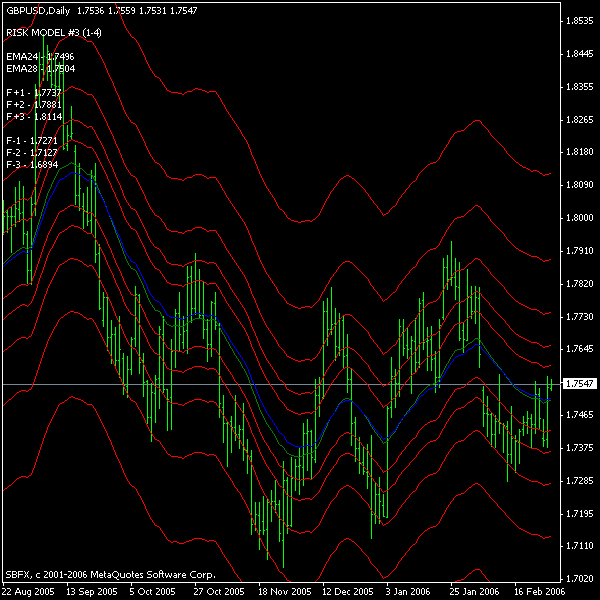
If you did it correctly your chart should look like the chart attached. I also included the inputs that should be shown by the indicators. Hope this helps, East
MT4 VWB Models 1-4
- eastmaels replied Feb 28, 2006
Ohhhhh.... So now that explains why you're always on mud pack to cover those burns... Sweet revenge...
which way it`s easier to make 500p a moth!!!

- eastmaels replied Feb 27, 2006
Inputting Risk Model — After doing the above step, a pop-up window/input box will be displayed. Here, you can input the risk model by clicking on the "Inputs" tab as shown in the image below: To overlay risk models, just repeat the step in the ...
MT4 Indicators Usage Tutorial/MQL4 Reference Documents
- eastmaels replied Feb 27, 2006
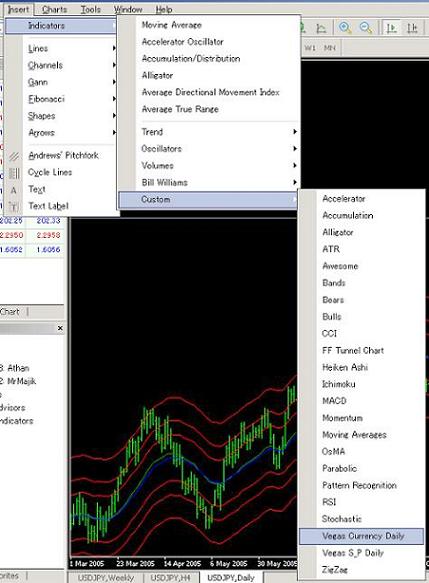
Inserting Custom Indicators to Chart — Insert Custom Indicators by referencing the image below:
MT4 Indicators Usage Tutorial/MQL4 Reference Documents
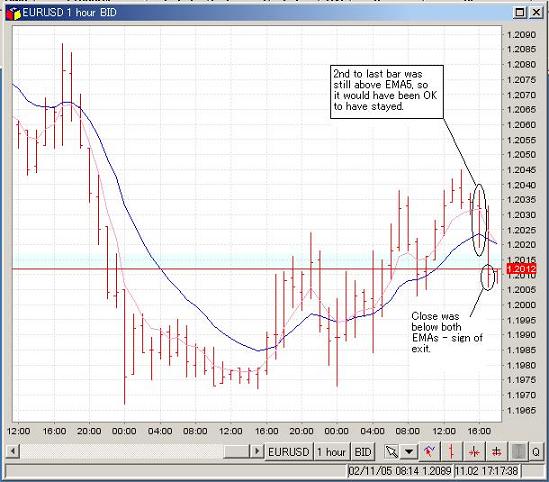
- eastmaels replied Nov 2, 2005
Trade 001 Exit: 1.2013 — Liquidated my position @ 1.2013 Trade turned sour.. with EMA5 crossing EMA13, with the close below both EMAs. Note: This was a good exit for me. I could have stayed and waited for the trade to recover, but if I did ...
Newbie Factory Journal