- Search Energy EXCH
- 44 Results
- dragos_ replied Feb 3, 2019
And one more, allthough I think is not fresh. Looking forward for your feedback, thanks image
High Level Accuracy Method With Little To NO Draw-down
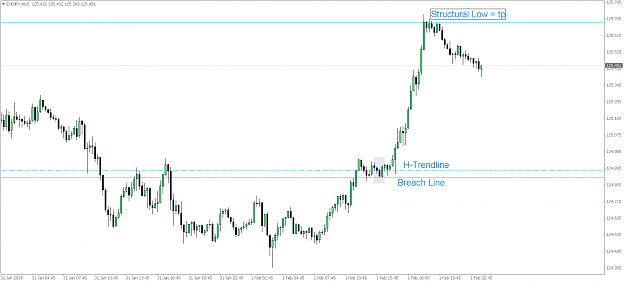
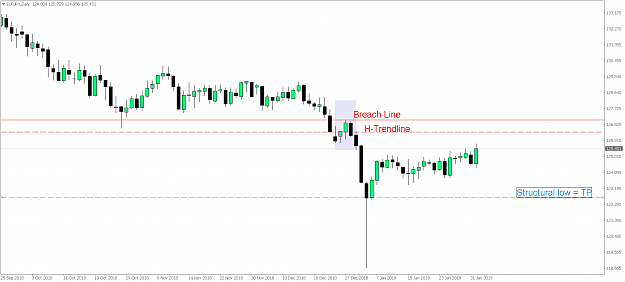
- dragos_ replied Feb 3, 2019
Hi FXCyborg, Could you please say if this qualifies as a valid setup based on your rules, and if not what are the reasons? image Moreover I would like to mention that I am not very clear with Structural low. It would be helpful if you elaborate a ...
High Level Accuracy Method With Little To NO Draw-down
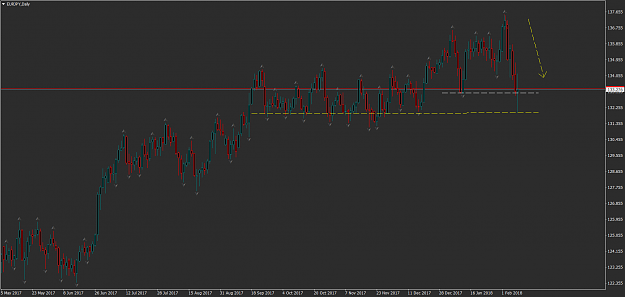
- dragos_ replied Feb 10, 2018
Hi janpec1000, What do you think about this chart? Does it look bearish to you? I remember reading not to look above M1...however I've just thought to ask for your opinion Thanks, Dragos
(binned per thread starter's request) Market bottom rotation trad
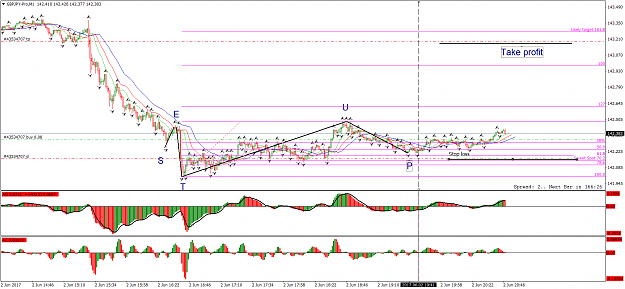
- dragos_ replied Jun 5, 2017
To me this looks like a SETUP so I entered long.. Update: +20 pips. Exit due to news
The SETUP and the Chuvashova Fork
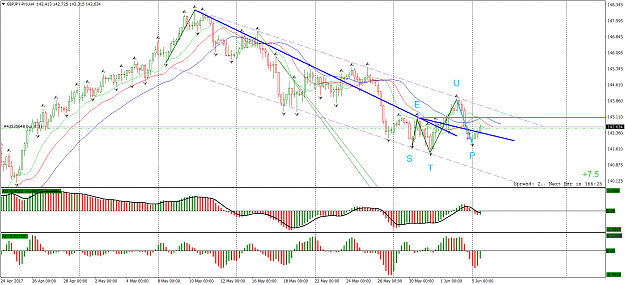
- dragos_ replied Jun 2, 2017
Short question, back to basics
The SETUP and the Chuvashova Fork Is this HH HL LH LL count correct? What about the SETUP count?
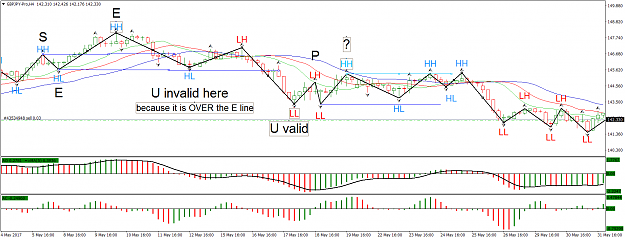
- dragos_ replied Jun 2, 2017
To be honest I am not doing so well as you do. Lost focus these days, overtraded low time frame charts and lost pips (however small size lots so is fine) - did not stick to the rules. I decided to give it a try to GJ, pair which scared me in the ...
The SETUP and the Chuvashova Fork
- dragos_ replied May 30, 2017
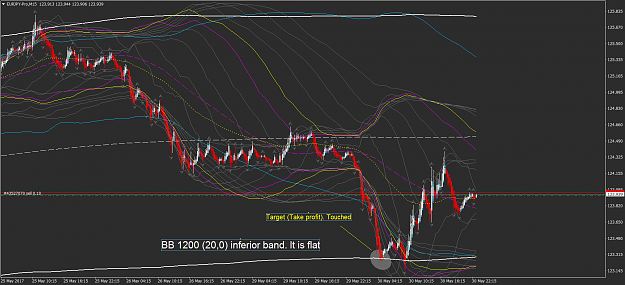
Sure. You can find it attached. What I posted before was on M15. If you look now on H1 you will see that inferior bands of BBs are moving away from the price, down. This tells me that on short term the price can should fall down, because it will not ...
The SETUP and the Chuvashova Fork
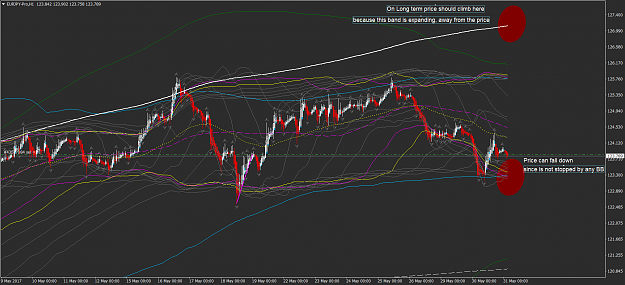
- dragos_ replied May 30, 2017
Hi Wab, Actually I catched that move. Would like to show you something, which may be used as additional tool for take profit. I use many Bolinger bands as I've seen a trader here called scalpeur doing it. When the price goes to a BB and the band's ...
The SETUP and the Chuvashova Fork
- dragos_ replied May 30, 2017
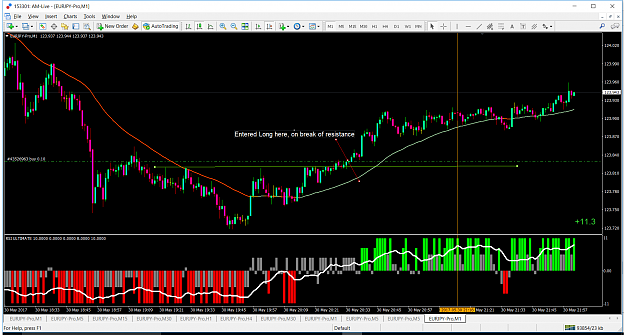
I saw an opportunity to enter Long after price topping up while making Higher Lows. Entered Long on break of resistance line..then waited hoping to see RSI Ultimate confirming with a green signal, which fortunately happened
(binned per thread starter’s request) Simplified Indicators by DR will exit trade ...
- dragos_ replied May 29, 2017
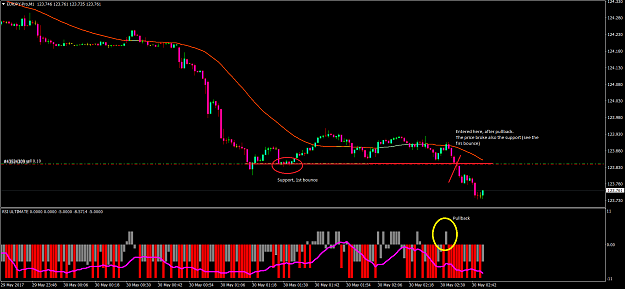
Hi, By curiosity decided to scalp with RSI Ultimate. After last pullback entered short, considering also that price had just broke the support line from the 1st bounce. The RSI MA was also trending down, having a value around 7. I was not too ...
(binned per thread starter’s request) Simplified Indicators by DR
- dragos_ replied May 25, 2017
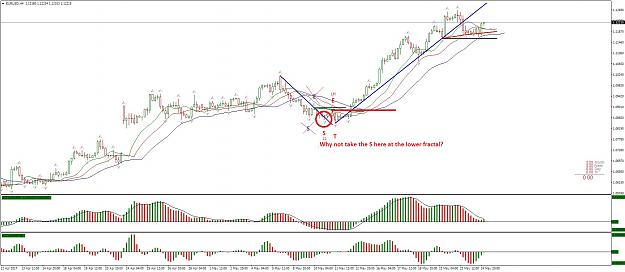
Wab, I would have a question regarding the last chart If I may. Why you have taken the E there, and not at the lower high fractal? Thanks, Dragos
The SETUP and the Chuvashova Fork
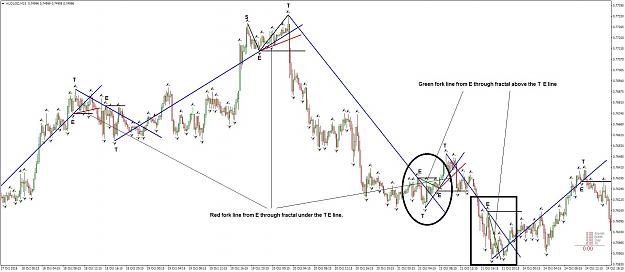
- dragos_ replied May 24, 2017
I don't get it. In the circle the forkline is on the right of TE, while in the rectangle the forkline is on the left of TE. Still both of them are bullish forks?.. If that's the case, then what do they say more than the SETUP itself? Thanks, Dragos
The SETUP and the Chuvashova Fork
- dragos_ replied May 24, 2017
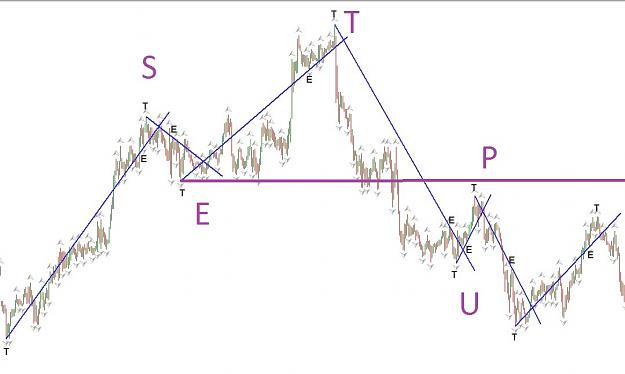
It looks like a SETUP to me
The SETUP and the Chuvashova Fork Also it seems to be a bearish trend.
- dragos_ replied May 18, 2017
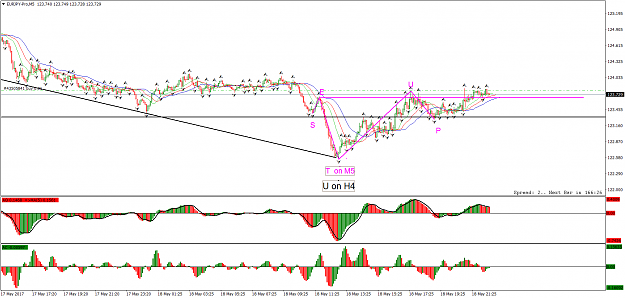
Meanwhile I am looking for a bullish reversal on M5, on H4 U area
The SETUP and the Chuvashova Fork
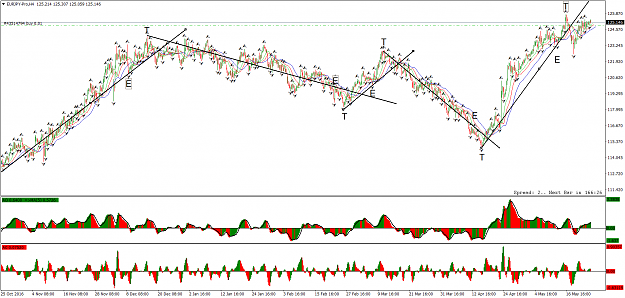
- dragos_ replied May 18, 2017
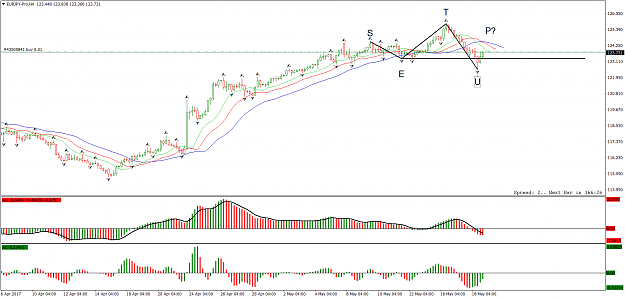
Hi, You might also want to check EURJPY H4 for a SETUP (P not yet formed) Best regards, Dragos
The SETUP and the Chuvashova Fork
- dragos_ replied May 16, 2017
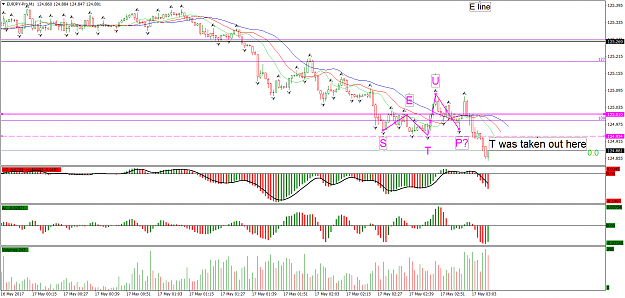
Buy SETUP on M1? UPDATE: it seems not. T was taken out
The SETUP and the Chuvashova Fork
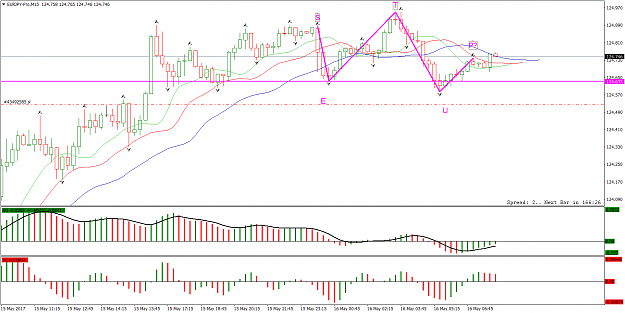
- dragos_ replied May 16, 2017
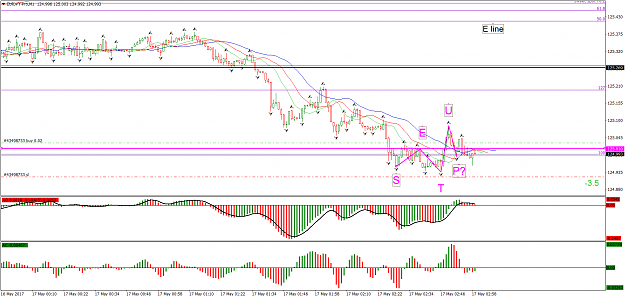
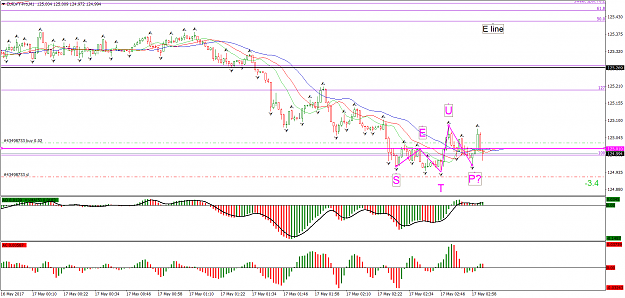
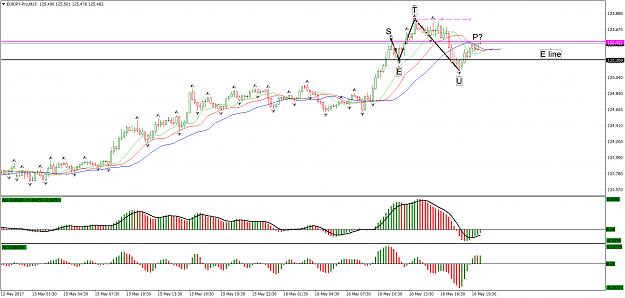
Bearish setup. Waiting for P to form on M15. While waiting for P to form, I am watching M1 for a bearish SETUP. url UPDATE: SETU formed on M1. Waiting for bearish break of the E line on M1 in order to confirm also the P of the M1 SETUP. Once the ...
The SETUP and the Chuvashova Fork
- dragos_ replied May 16, 2017
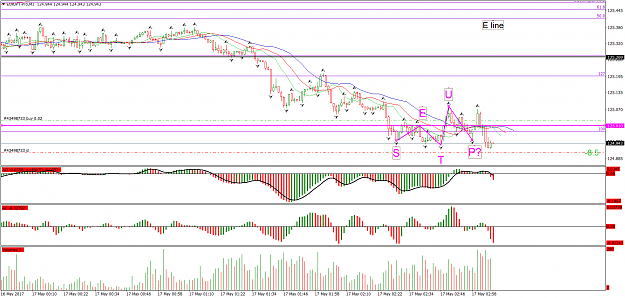
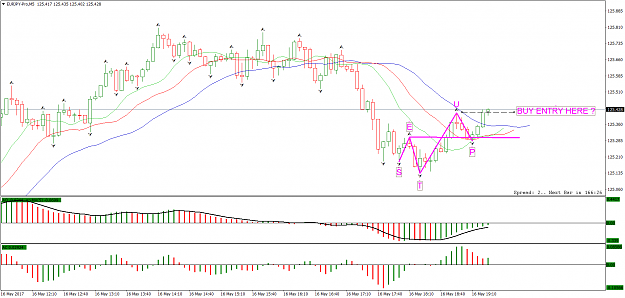
What about this setup? Is it safe to buy at crossing of U level? Update: closed on profit, because the bullish trend might be over, due to lower low. Looking to sell from now
The SETUP and the Chuvashova Fork
- dragos_ replied May 16, 2017
Is this a valid SETUP? The P fractal was formed but it was exceeded by a candle afterwards.
The SETUP and the Chuvashova Fork