- Search Energy EXCH
- 102 Results
- dr mongolia replied Apr 6, 2011
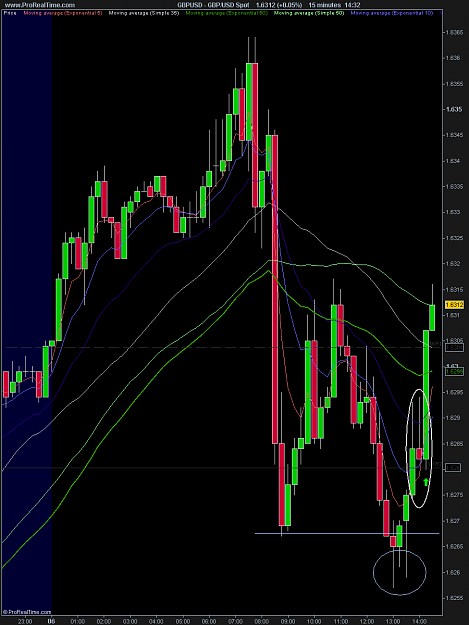
Here's a G/U trade from this morning, I like to take this setup as a 20-40 pip scalp when I see it happen. My entry was at the open of the candle with the green arrow on it, at 1.6282. It might seem a little odd to go long after those two wicks, but ...
Ken's Continuing Successes with EO's system
- dr mongolia replied Mar 31, 2011
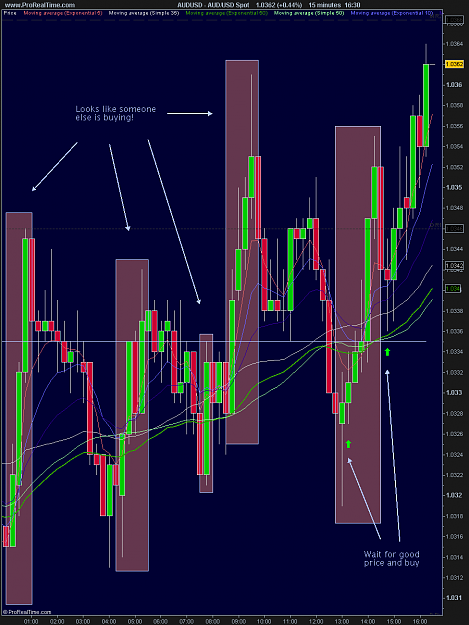
Here was my thought process on A/U earlier. Just watching prior PA and then finding a good price. Managed to get two positions on, waiting to see how they play out.
Ken's Continuing Successes with EO's system
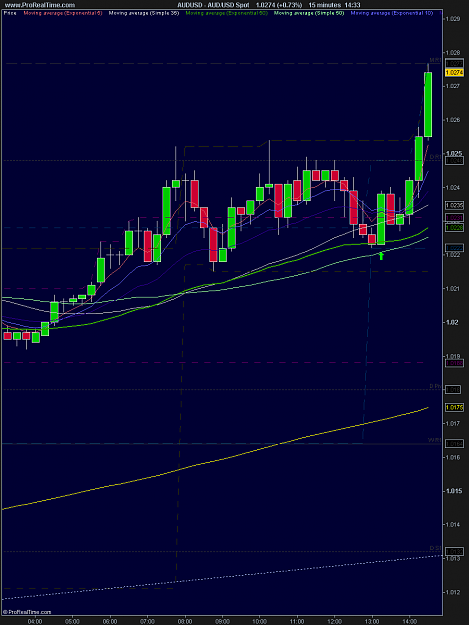
- dr mongolia replied Mar 29, 2011
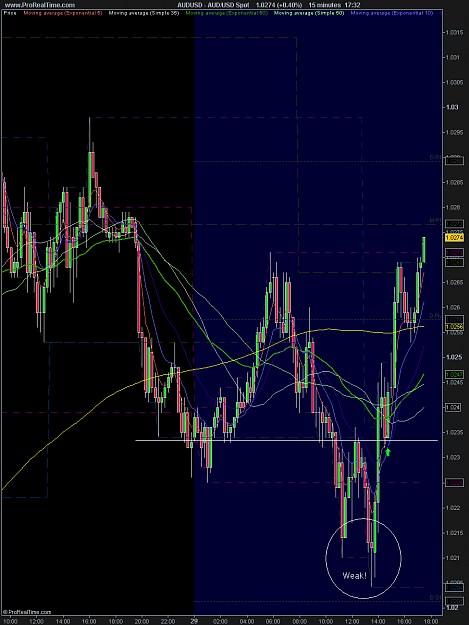
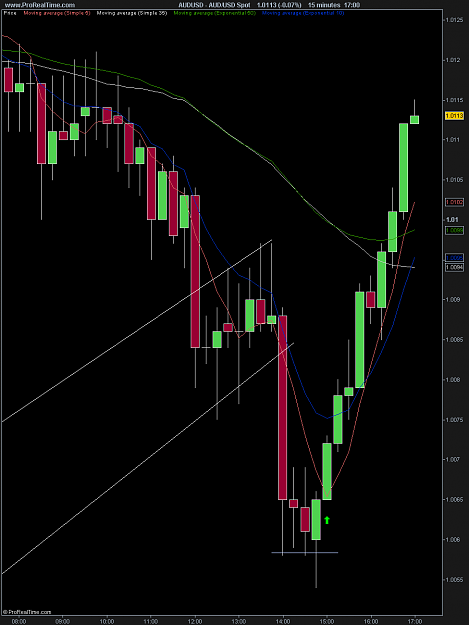
Hey guys I know this is getting really redundant but just trying to show how simple the entries can be if you just pick an area or two on the charts and watch it carefully. Here's another 15m 50ema-based trade on A/U. In the past I've been very weak ...
Ken's Continuing Successes with EO's system
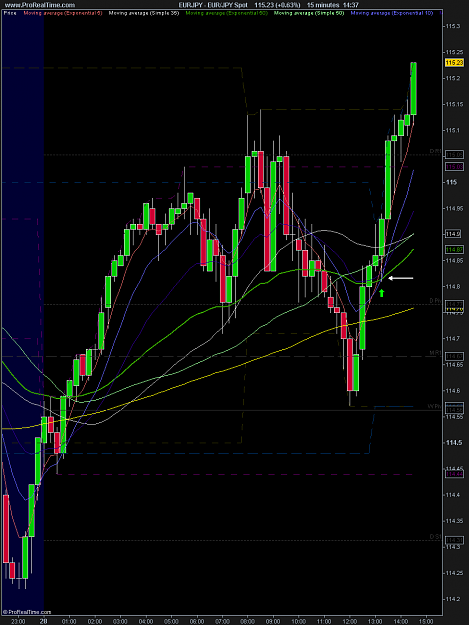
- dr mongolia replied Mar 28, 2011
Hey guys. Here's my two trades for the day. Both of these entries are based on the 50ema and the US open.
Ken's Continuing Successes with EO's system
- dr mongolia replied Mar 25, 2011
Here was my trade for the day, A/U 15M. Entry was off the 50EMA (bolded darker green line, the thinner light green is the 50SMA). In addition to the 50EMA I was looking at the session action (price started trending during Asia, stops during London ...
Ken's Continuing Successes with EO's system
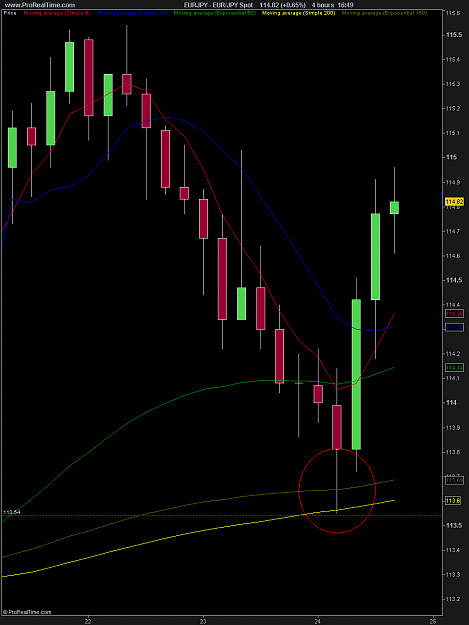
- dr mongolia replied Mar 24, 2011
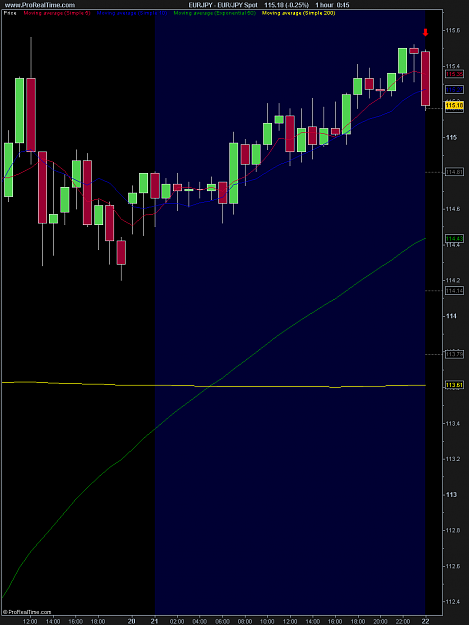
And now.. for the WORST trade of the day. I don't intraday trade the London/Asia overlap anymore on most days so I've been working on POs. Here's my 4H E/J chart, note the dotted red line and guess where my PO was
Ken's Continuing Successes with EO's system
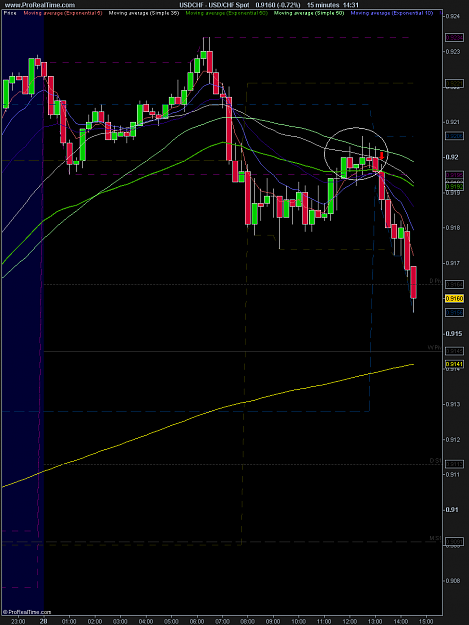
- dr mongolia replied Mar 23, 2011
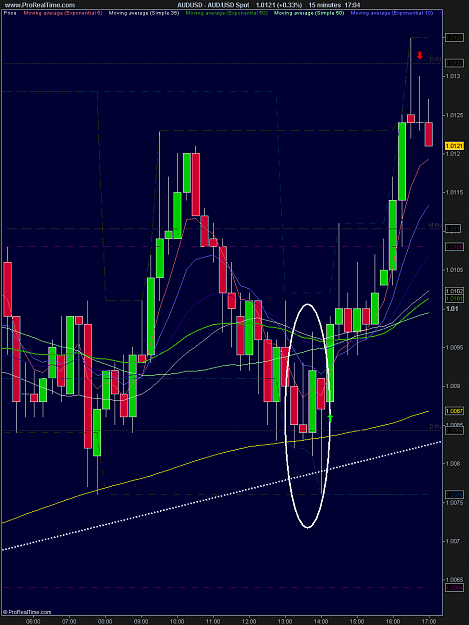
Awesome trading man! Yeah the HTFs don't always give us entries-- on days like today where price is ranging around, it's good to have some 15M tricks up your sleeve. I took this scalp earlier based on the 15M PA circled in white, then used my 4H to ...
Ken's Continuing Successes with EO's system
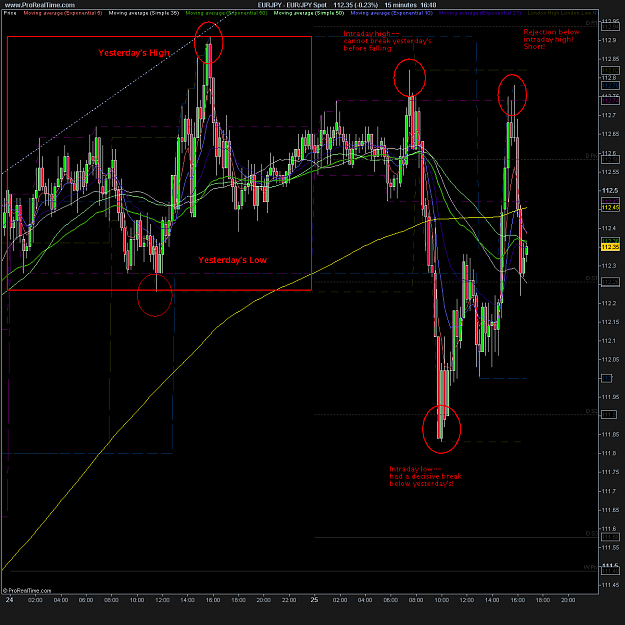
- dr mongolia replied Mar 21, 2011
Here's another trading idea that I've been using lately. When I see the last 1H candle of the day make a new high or a new low for the day, I look to enter in the opposite direction right around the open of the next candle. Obviously timing is ...
Ken's Continuing Successes with EO's system
- dr mongolia replied Mar 21, 2011
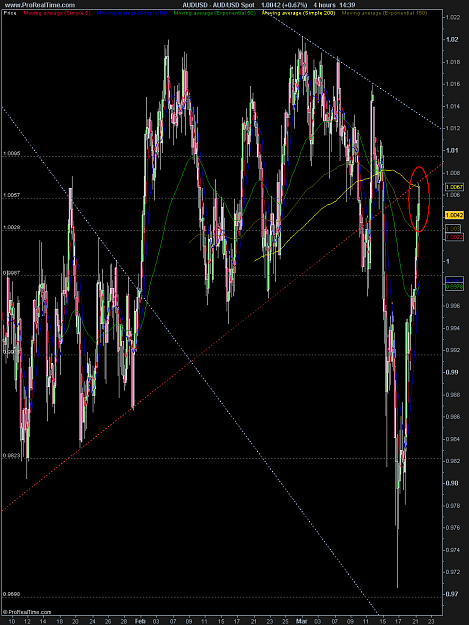
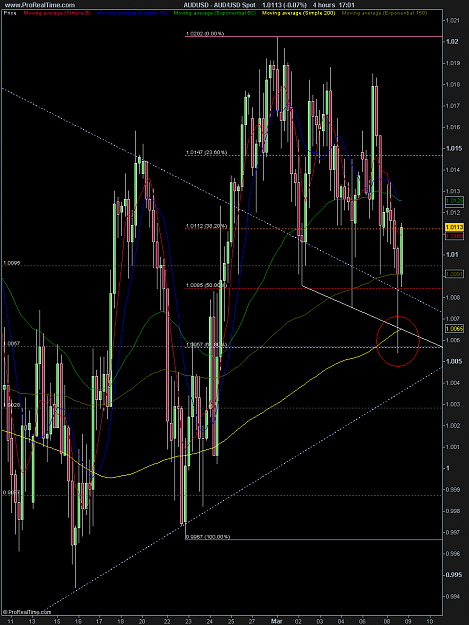
Here's my entry on that A/U trading idea, 4H chart attached, zoomed out to show the full 4H chart. On my charting software and I'm sure most others it gives you the option of applying daily TL's to the lower TF charts like 4H/1H, but I prefer to ...
Ken's Continuing Successes with EO's system
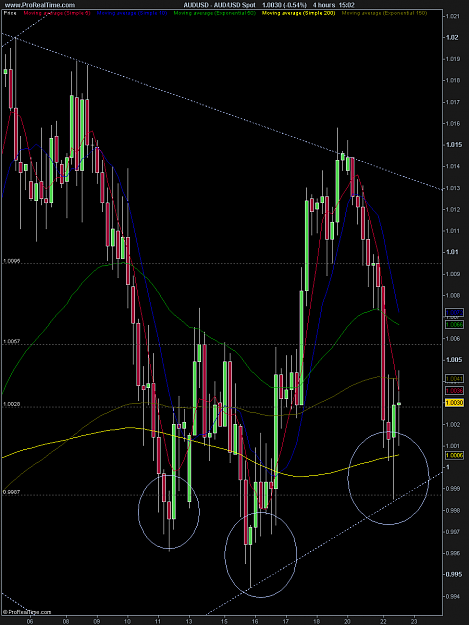
- dr mongolia replied Mar 20, 2011
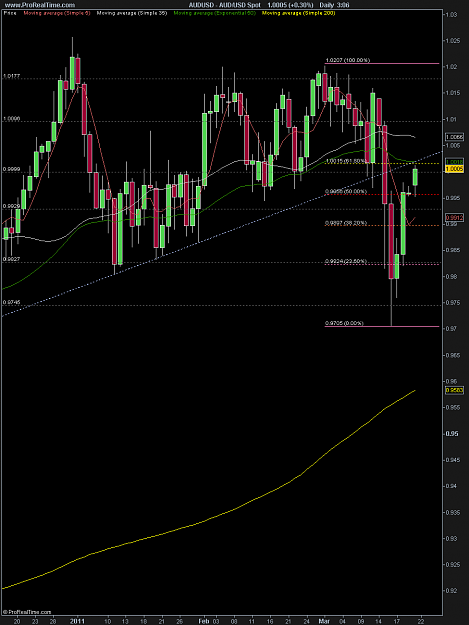
Just a thought on A/U, daily chart attached. On these I like to find 15M supporting PA and cover at +10. That way you can keep reentering and not get frustrated if PA ranges around on you, at least you get to pick up some small pips if it doesn't ...
Ken's Continuing Successes with EO's system
- dr mongolia replied Mar 16, 2011
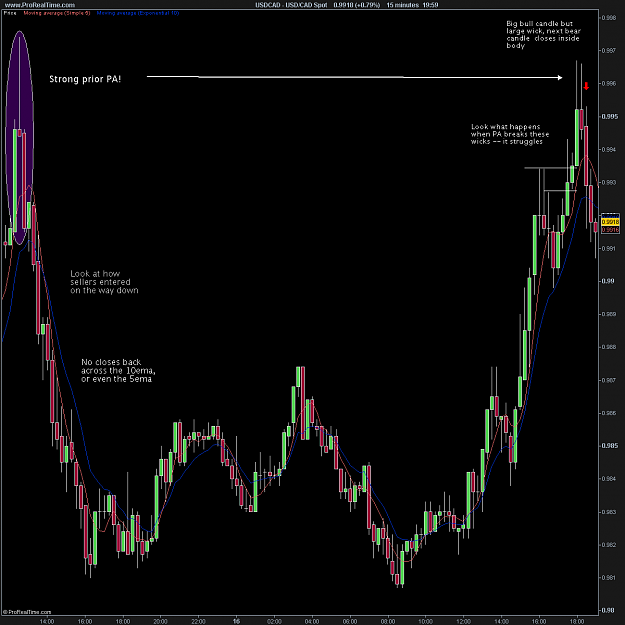
Hey, here's an entry from earlier, 15M U/CAD, it's a retest entry from the same trade I took yesterday. It hasn't completed yet but it's looking decent so far. I like retests when the prior PA was strong and we had a lot of sellers (or buyers, in ...
Ken's Continuing Successes with EO's system
- dr mongolia replied Mar 15, 2011
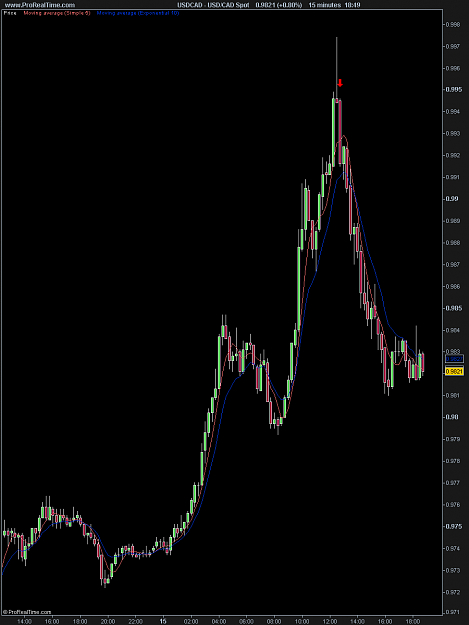
Hey guys just checking the thread. Here's a chart to think about, U/CAD 15M. If you put some session lines on your charts you'll notice that it's rare for price to trend strongly in the same direction for 3 sessions in a row, and when it does you ...
Ken's Continuing Successes with EO's system
- dr mongolia replied Mar 8, 2011
Hey guys just popping in to check the thread. Here's a 4H chart for an easy A/U trade -- it's almost identical to the one I posted last week. I got a question about the one last week because I didn't explain it very well so here's a more thorough ...
Ken's Continuing Successes with EO's system
- dr mongolia replied Mar 4, 2011
Hey guys, popping in to check the thread. I've been focusing more and more on the charts lately so I haven't had as much time as I still have business obligations as well. Here's a quick scalp from earlier; this is a 4H chart of A/U. The ...
Ken's Continuing Successes with EO's system
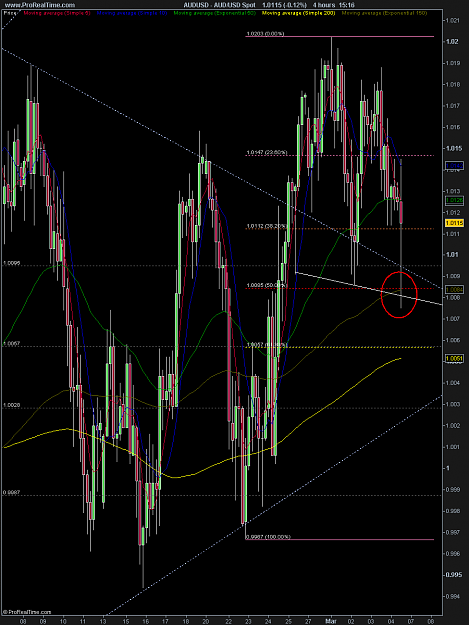
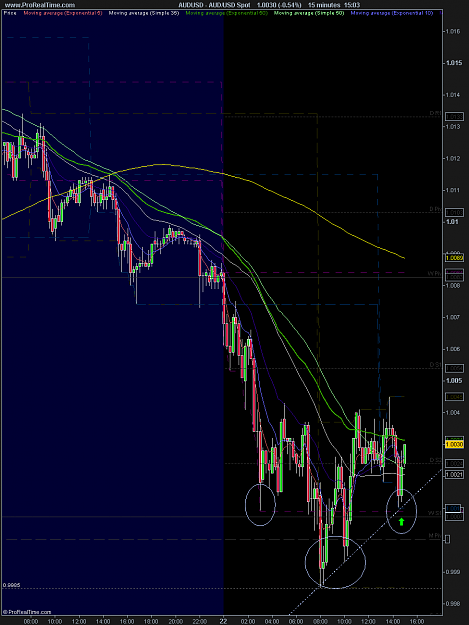
- dr mongolia replied Feb 22, 2011
Hey guys, great charts! Here's a long I just took a few minutes ago on A/U. The 15M chart is first, it shows the entry at 1.0009 which was the Asian low (dashed pink line) that price couldn't hold below. The 4H chart shows the reason I am willing to ...
Ken's Continuing Successes with EO's system
- dr mongolia replied Feb 2, 2011
And here's another example of one that did work for around 100 so far, same trade idea
Ken's Continuing Successes with EO's system
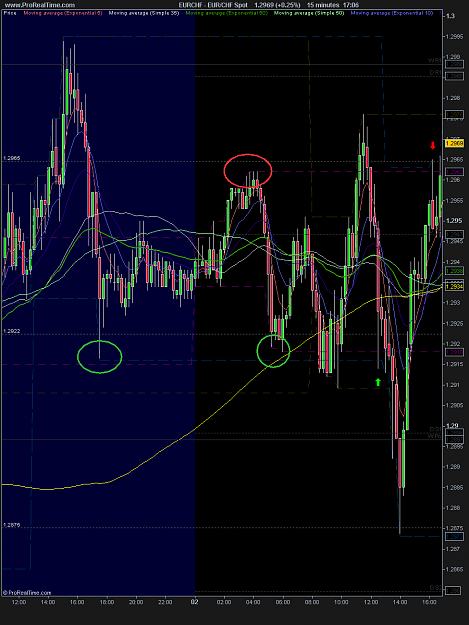
- dr mongolia replied Feb 2, 2011
I'm posting this chart as an example of some range trades that I was discussing with a thread member. On these particular trades you would have been stopped out at BE or a slight loss, depending upon trade management. The dashed lines are session ...
Ken's Continuing Successes with EO's system
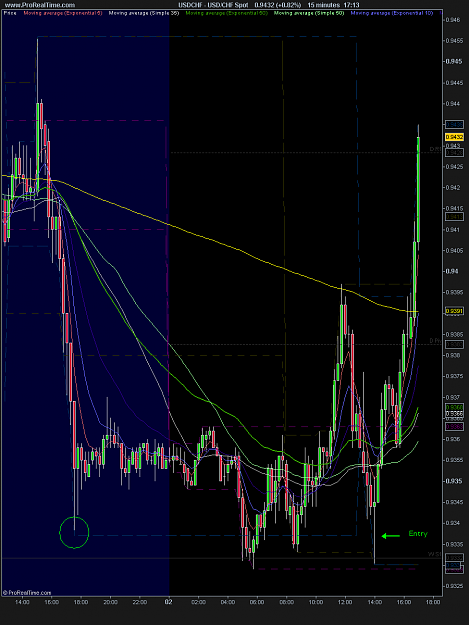
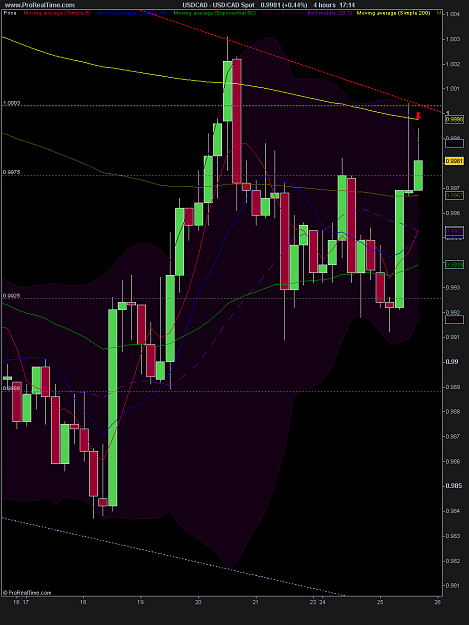
- dr mongolia replied Jan 25, 2011
Speaking of shorting up the wick, here's USD/CAD 4H chart. If you check the 15M you can see where the working 4H candle showed rejection at.. on these trades, if I can't find a good entry spot on the 15M I'll just wait for a close back across the ...
Ken's Continuing Successes with EO's system
- dr mongolia replied Jan 25, 2011
Here's another chart based on the principles that we talk about in this thread-- prior price action, significant levels, and swings/highs/lows. It's a 15m chart, to read the text you'll need to double click on the image and zoom in (so that it opens ...
Ken's Continuing Successes with EO's system
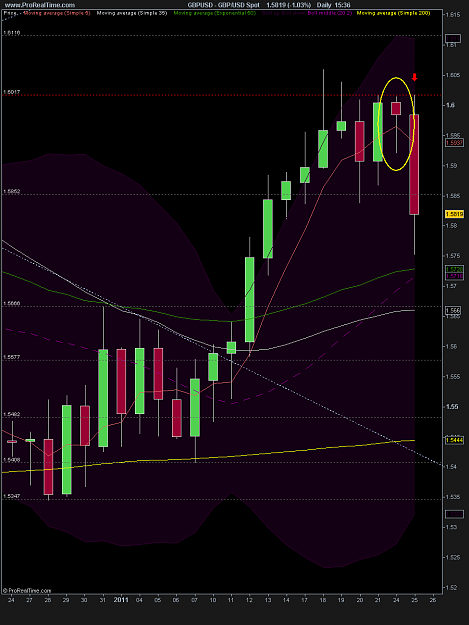
- dr mongolia replied Jan 25, 2011
We talked a little bit lately in this thread about posting more entries from the system. GU give a textbook system entry last night during Asia---- the daily candle closed as a bearish hangman below 1.6, the high of the candle was the high of the ...
Ken's Continuing Successes with EO's system