- Search Energy EXCH
- 212 Results (1 Thread , 211 Replies )
-
 dove_alliance replied Sep 27, 2019
Alright traders - the Paradox is setting itself up for the weekend. The screenshot below is showing a yellow horizontal line which represents the next lower bar for the 100% Fibo line. As I am writing this posting up the bar that is running got ...
The Paradox System
- dove_alliance replied Sep 4, 2019
This is from last night will all the analytical BS and no rules being apply - here is your screenshot with the Parabolic flip below. The Fibo is Green being up. The 23.6 Fibo is resistance. And what is this telling you with applying the Fibo ...
The Paradox System
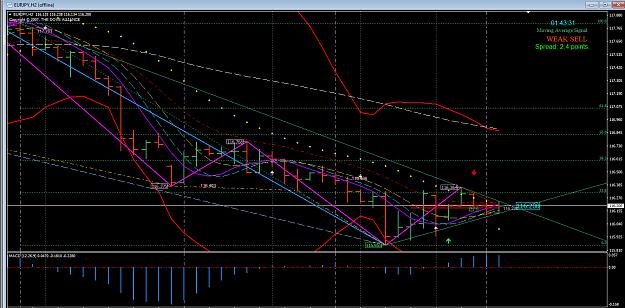
- dove_alliance replied Aug 28, 2019
Here is my H2 chart. If it does not look exactly like this one then your chart is wrong. image
The Paradox System
- dove_alliance replied Aug 9, 2019
The posting above was with the H1 and I forgot the H2. The H2 is showing the hit on EMA for the breakout with the H1 Parabolic. The H1 was showing the ranging and that is why I Posted it was as a reference for the ranging. Here is the H2 with the ...
The Paradox System
- dove_alliance replied Aug 9, 2019
OK traders - here a screen shot of the Break Out. If you remember what I had said about the DB/SAR running together with the DB showing then you would realize you was in a ranging mode. The ranging will not stop UNTIL THE SAR breaks away from the ...
The Paradox System
- dove_alliance replied Jul 2, 2019
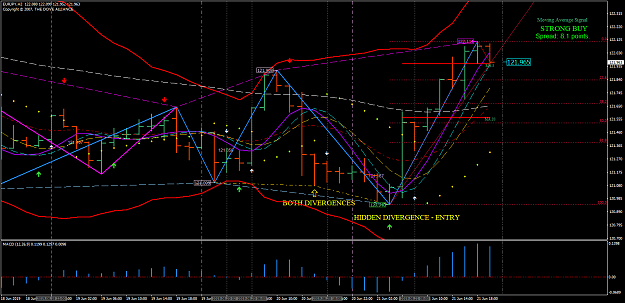
You didn’t need to delete your post as you was pretty much right on. So let me post this screen shot and give you the reason why Iris trade was bad. image Let me start to the left with the first down arrow. Standard and Hidden Divergences connect ...
The Paradox System
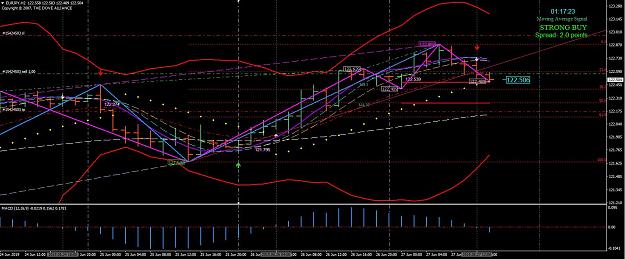
- dove_alliance replied Jul 1, 2019
image Above is Iris entry according to the trading plan on Thursday the 27th of June. Iris let this trade run over the weekend because Iris believed the TP would be hit. And thinking this way Iris broke a major trading rule which is never, ever ...
The Paradox System
- dove_alliance replied Jun 25, 2019
I had a trader PM me with a question. NOW - if any trader has a question do not PM me but ask the question on the forum as it may relate with the same question others may have. So - here is the question: If you get a moment I wondered if you could ...
The Paradox System
- dove_alliance replied Jun 22, 2019
That is correct - it did go lower low and my question for you: What was the reason for lower low? The answer is this screen shot. image
The Paradox System
- dove_alliance replied Jun 21, 2019
I had a trader not long ago asking me to train him on long term trading? I didn’t answer him because he knows I no- longer train any one for any reason, as my life is filled and I do not have time to train. But I will give you this tutorial for the ...
The Paradox System
- dove_alliance replied Jun 21, 2019
OK Traders - let me go through Iris entry and what NOT TO DO. image To begin with Divergence is a very powerful indicator - especially when it is set up properly. On Iris 2 hour entry chart it is showing a green EMA arrow prior to Iris entry. On ...
The Paradox System
- dove_alliance replied Jun 12, 2019
I am on a live account server 121 and it is exactly like yours on live server 7. image
The Paradox System
- dove_alliance replied Jun 3, 2019
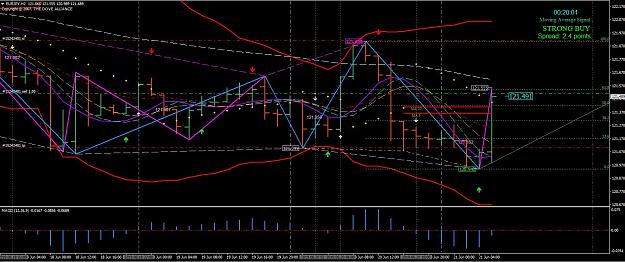
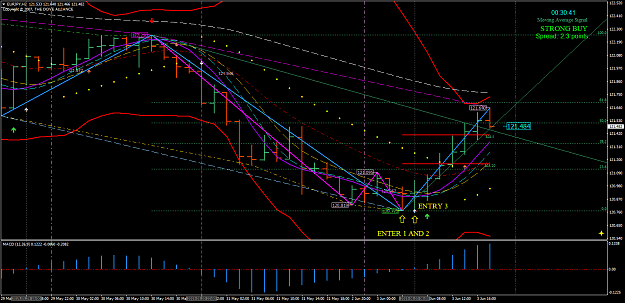
To update my last posting with SuchParadox - Here is a screen shot of 3 entries going north. Because of the heavy support along with the Fibo "0" there were two hits on the Fibo zero. The third entry was with the open bar above Smooth with White ...
The Paradox System
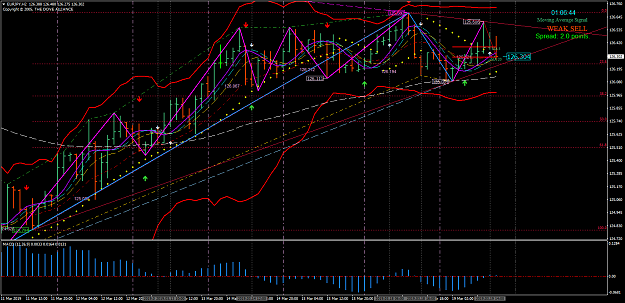
- dove_alliance replied Mar 19, 2019
OK - I should had sent a picture of the one on top to my trading computer. The one top which were the first set is with my laptop. I should had known better. The one on bottom is this computer which is my trading computer and it is correct. Here is ...
The Paradox System
- dove_alliance replied Mar 19, 2019
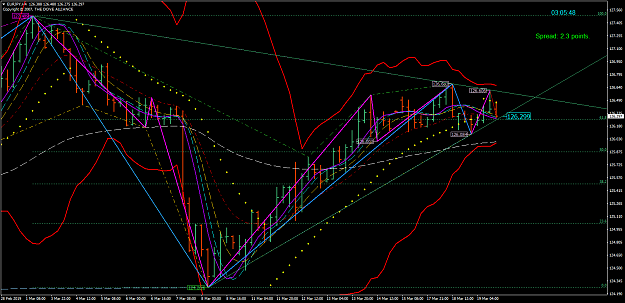
Here are the H2 and H4 spread out to see what your charts should look like: H2 image H4 image
The Paradox System
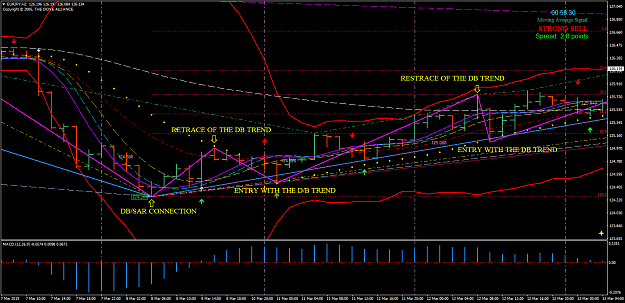
- dove_alliance replied Mar 18, 2019
What is amazing is after the training I done a couple of weeks ago in how to use the DB/SAR with Divergences - not one of you had the courage showing the light of what you have learned. All you guys had done is watch this market move 241 pips in an ...
The Paradox System
- dove_alliance replied Feb 28, 2019
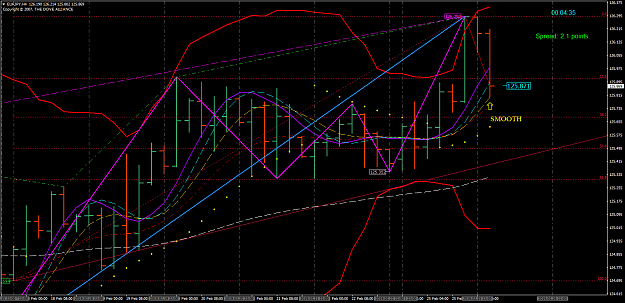
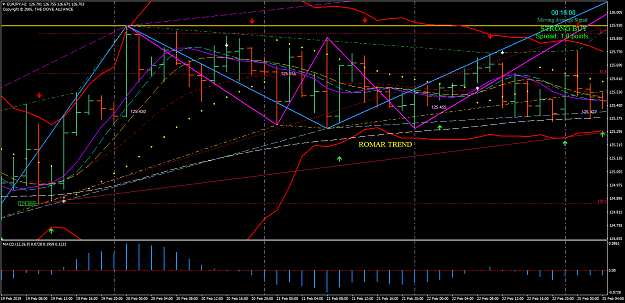
The most important indicator on all charts is ROMAR: ROMAR is your trend for each chart. In the moment you have ROMAR as support on the lower charts and both support/resistance on the Daily. The reason the Daily is both is because it crossed Purple ...
The Paradox System
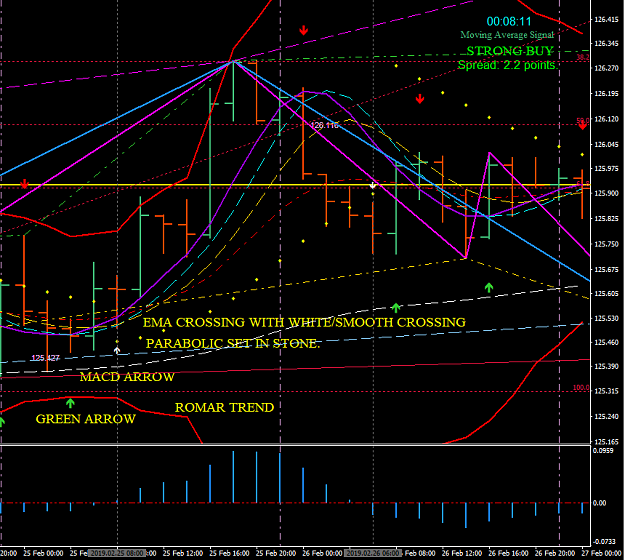
- dove_alliance replied Feb 27, 2019
Below is Devon's entry chart. You will notice a white dash horizontal line at the DB/SAR with the Standard Divergence. The next bar the SAR attached for a short to support which was ROMAR. The rule is: no trade to support but you do create your ...
The Paradox System
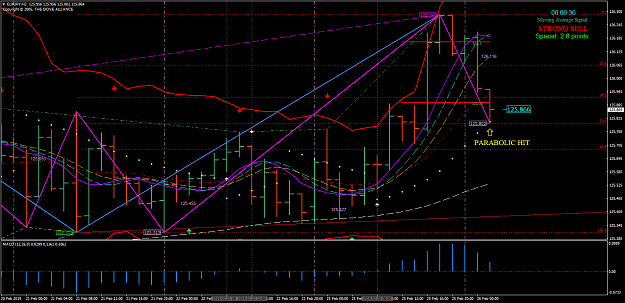
- dove_alliance replied Feb 26, 2019
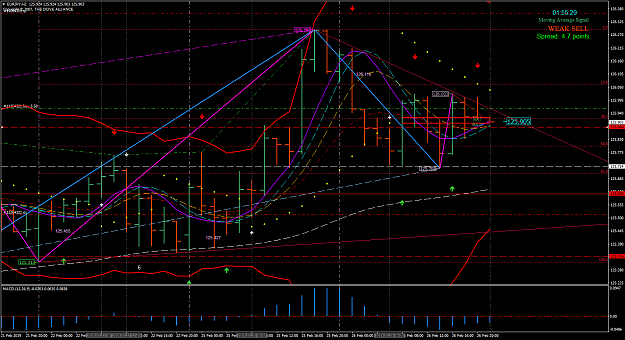
The Daily chart is a very, very import chart for a 24 hour period. And the Daily operates the same as the lower charts. The only difference is being a 24 hour chart; which gives you visuals for 24 hours. On today's 24 hour hours you see resistance ...
The Paradox System

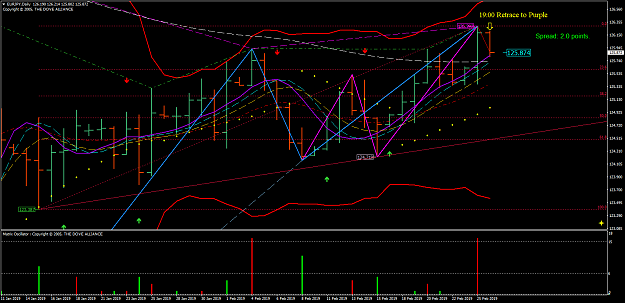
- dove_alliance replied Feb 25, 2019
I haven't seen any postings from anyone to talk about the 19:00 ET Daily Open bar. So let me give you the status of the Daily opening. Daily Purple should had been the subject of that opening. From opening bar to Purple (support) was just less of 40 ...
The Paradox System