- Search Energy EXCH
- 20 Results
-
 dennis681 replied Aug 29, 2014
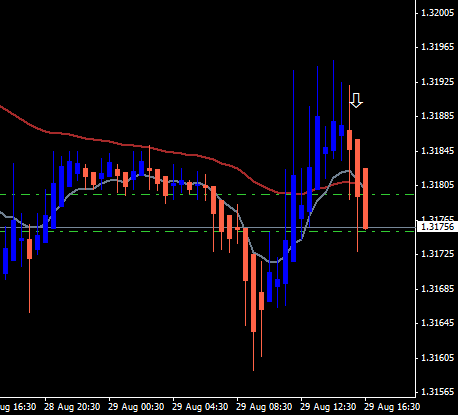
I like showing a live trade bc I want folks to see the power of simplicity. It's all about making pips, regardless of how easy or complex the system is. Just now, our 30M EU candle has crossed our slow MA in agreement with the trend. So I'm short @ ...
MA of H-A system
- dennis681 replied Aug 28, 2014
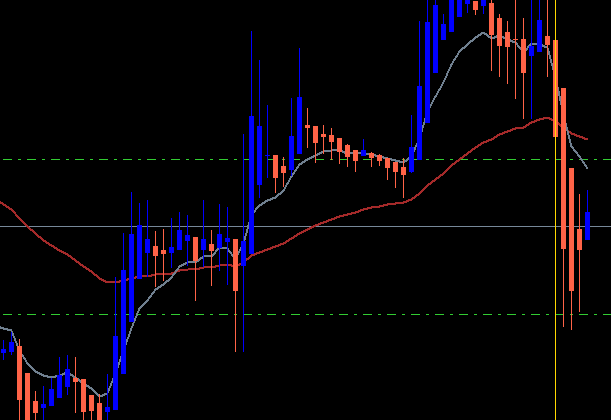
The classical exit is to wait for a breach of the Eur/Usd 5M fast MA. But in this case, since I saw divergence @ two candles before my actual exit (last pink candle - showing weakness), I exited after two blue candles in a row @ 1.3274 (net +7):
MA of H-A system
- dennis681 replied Aug 28, 2014
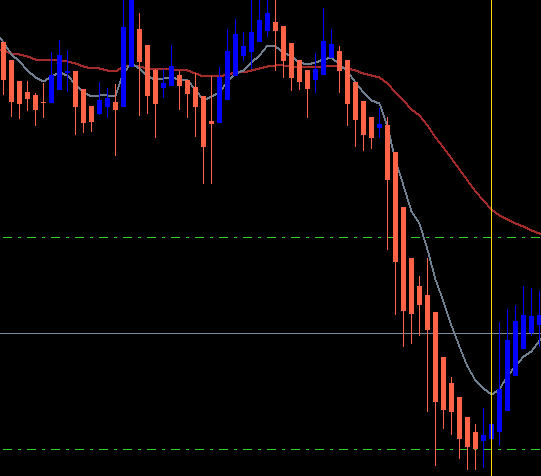
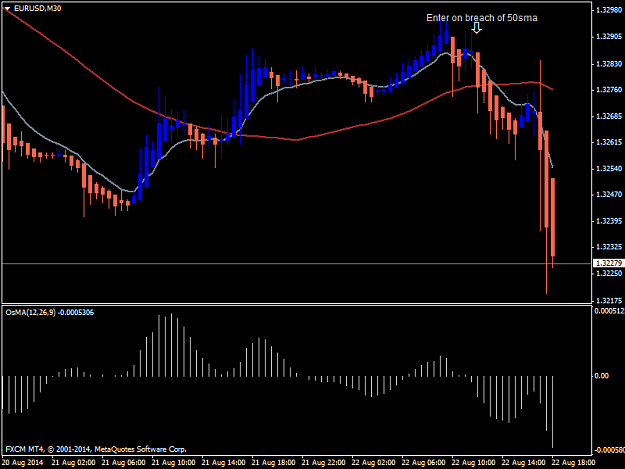
Next, we switch to the Eur/Usd 30M chart and look for the first occurrence of a declining candle breaching it's slow MA. And as you can see, that happened two hours ago. So the entry is at 1.3185, shown by the yellow line.
MA of H-A system
- dennis681 replied Aug 28, 2014
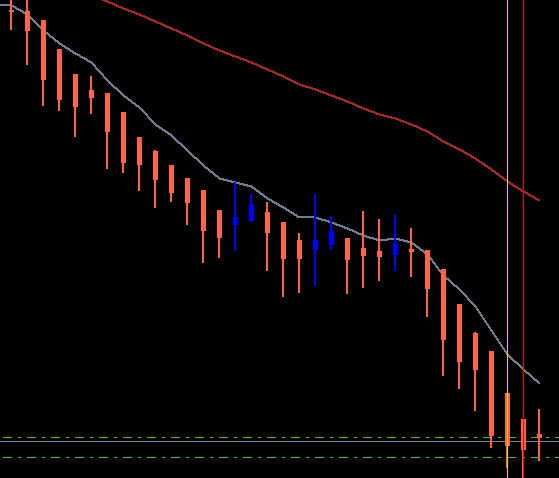
Sure. Here's a current shot of the Daily Eur/Usd zoomed in. The red line shows C1 and the yellow line shows C2. In this case, we have a declining trend since the 10ema (1.3258) for C1 is less than the 10ema (1.3273) for C2. So any new EU trade entry ...
MA of H-A system
- dennis681 replied Aug 26, 2014
Example of an ultra-conservative exit: (because it's late morning NY, I'm going to take my +9 now)
MA of H-A system
- dennis681 replied Aug 22, 2014
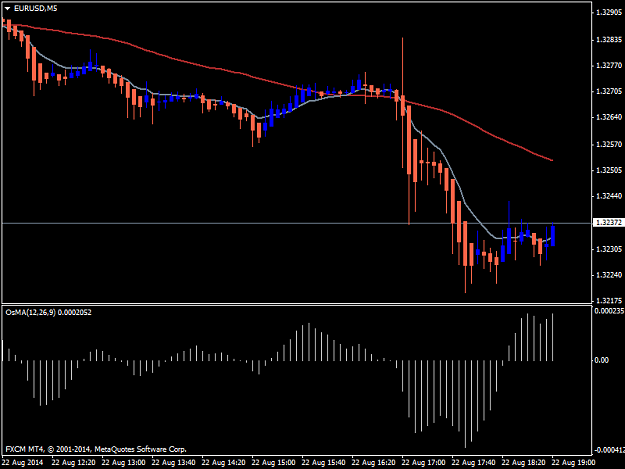
Example of an exit based on breach of the 5M fast ma:
MA of H-A system
- dennis681 replied Aug 22, 2014
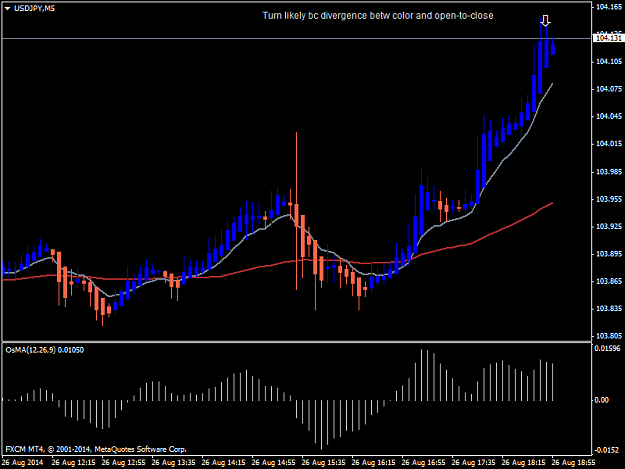
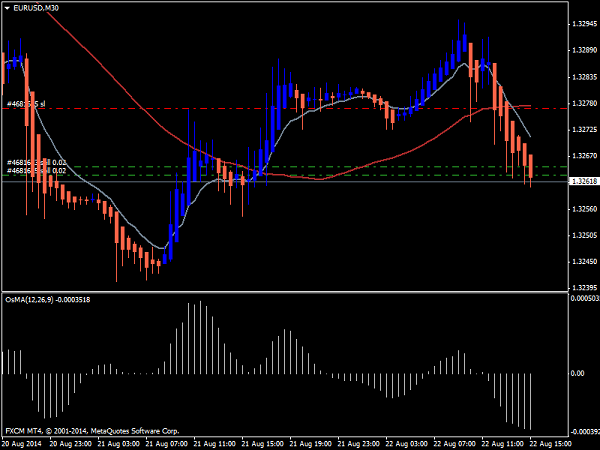
Here's an example of a very conservative exit based on two indications: 1) OsMa is reversing back towards zero 2) H-A candle heights are showing weakness:
MA of H-A system
- dennis681 replied Aug 22, 2014
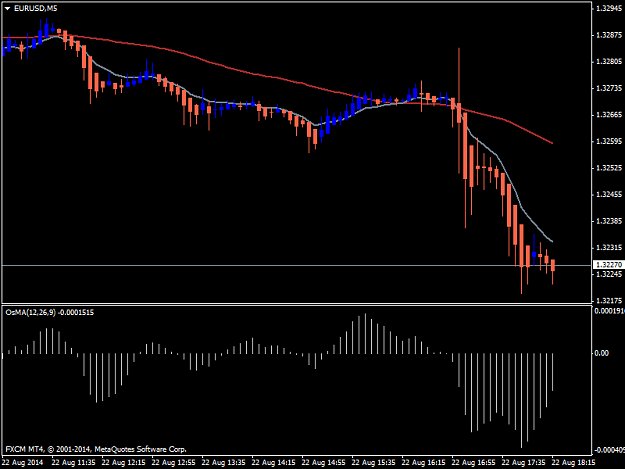
Short EU @ 3264 @ 30M @ 10 ema x 50 sma. Switched to 5M and will exit @ breach of 50 sma.
The art of Trading MAs
- dennis681 replied Aug 14, 2014
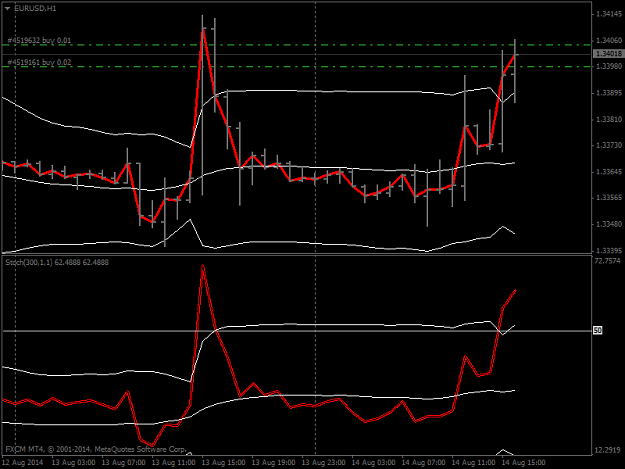
Newbie Question: Based on the chart setup: image I am looking for divergences between the upper and lower charts. So in order to know what's diverging, I'm looking at two things: 1) the relationship between the upper ema1-to-nearest band and 2) ...
The similarity system
- dennis681 replied May 18, 2010
Aha — I just became aware of the Commerical forum. Nice to see you all here. Hopefully I will be able to add something... Been trading 1H Eur long today, but it's been a bit rough. I've got my TP eye set on the 4H kijun @ 1.2478.
Ichimoku forever
- dennis681 replied May 18, 2010
Ichi consideration — 1H Ichimoku long is back on track as it approaches the 1.2458 kumo resistance. If it breaches, you might wish to consider setting a new resistance at the 4H kijun-sen. See chart...
EURUSD
- dennis681 replied May 18, 2010
. — Sens up, chinkou's up, stochs up. 1H upper kumo is 1.2458. Hold onto your longs mates.
EURUSD
- dennis681 replied May 12, 2010
Possible long? — I'm starting to see some glimmers of a long setup...
EURUSD
- dennis681 replied Feb 3, 2010
Heads up on possbile gbp short coming? — wjqblog got best entry using 5 min chart fibos. Heads up on GBP/USD possible retrace. My 4H chart trend is still down.
My Fibonacci trading system
- dennis681 replied Feb 3, 2010
Used the 1H fibo for same conclusion — Same result by drawing major and minor fibos on same chart (1H in this case) to find blue resistance/retracement/entry "box": (Are we having fun yet?)
My Fibonacci trading system
- dennis681 replied Feb 2, 2010
Well then, with deference to Pip26, here's what I'm looking at right now for a CAD short. Daily is also showing a strong bearish engulfing.
My Fibonacci trading system
- dennis681 replied Jan 12, 2010
Example of golden overlap box? — Are these two fibos correct to find area of strong resistence?
My Fibonacci trading system
- dennis681 replied Jan 8, 2010
Fri trade @ G7 @ chf for +65 easy peezy pippers. Thx again to wjqblog for sharing what seems like a solid method at first blush (maybe these are the honeymoon winners). I'll be testing it throughout January.
My Fibonacci trading system
- dennis681 replied Jan 8, 2010
Fri G7 Aud trade; +52 pips on that one. Thx wjqblog. Not sure what the need is for Fibo Expansion (FE) though. I was getting the same numbers with the Fibo Retracement. No prob, just wanted to mention it.
My Fibonacci trading system
- Posts by Member Search: 'dennis681'