- Search Energy EXCH
- 1,600 Results (9 Threads , 1,591 Replies )
-
 dee50 replied Nov 21, 2018
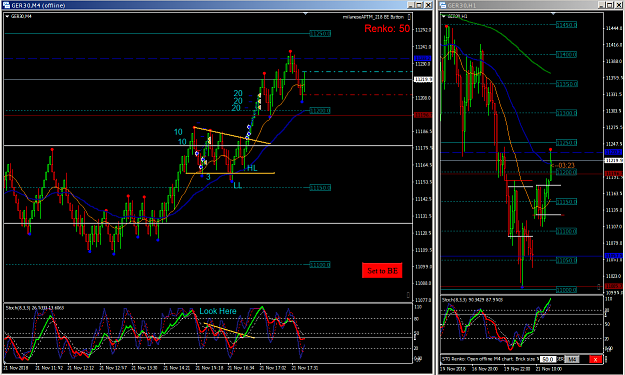
DAX +10+3+10+20+20+20. Patience and common sense and an understanding of what your indicators are telling you, The stochs and macd tell you a lot more than just Divergence!
More simple is impossible
- dee50 replied Oct 31, 2018
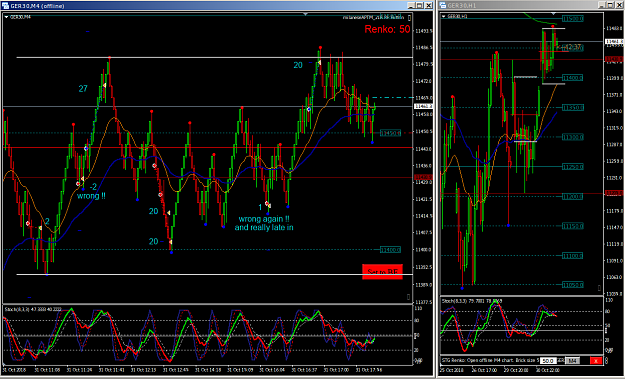
DAX +2-2+27+20+20+1+20. You are never too old for trading! I can not chase the young girls anymore (the girls are faster than me now) but I can still chase the PIPS.
More simple is impossible
- dee50 replied Oct 31, 2018
Nice to see you back.
More simple is impossible Just a reminder of the many (543) who have contributed so much to this thread.

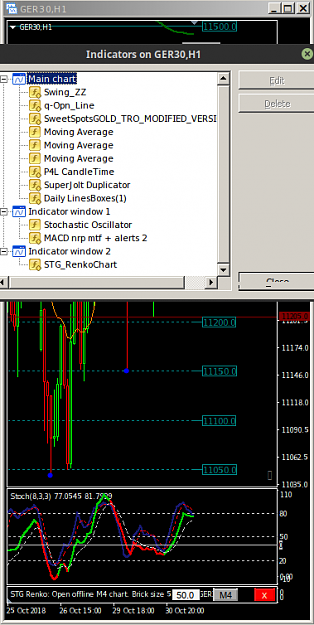
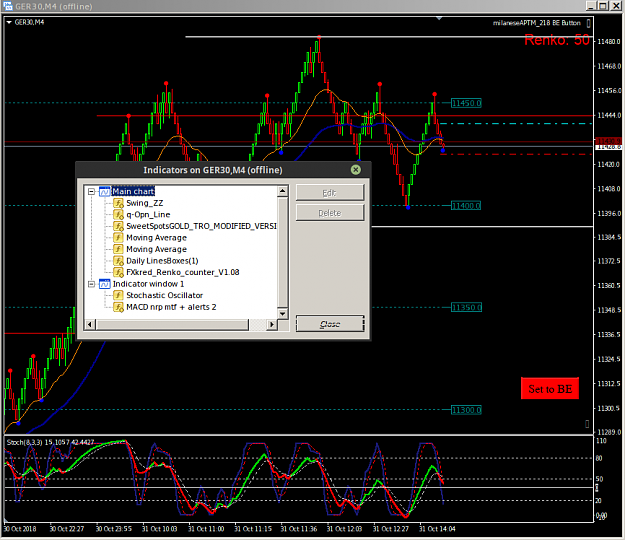
- dee50 replied Oct 31, 2018
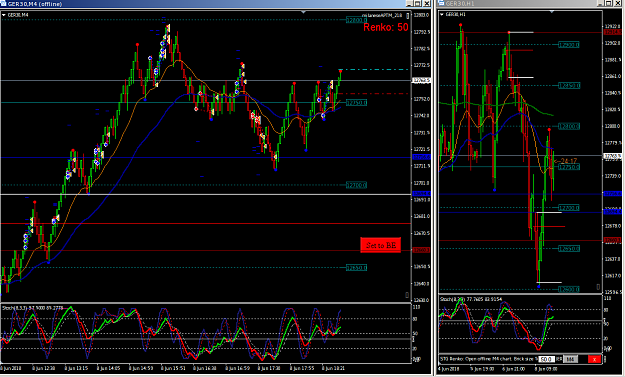
Renko chart settings are in the 1hr chart template. image image
More simple is impossible
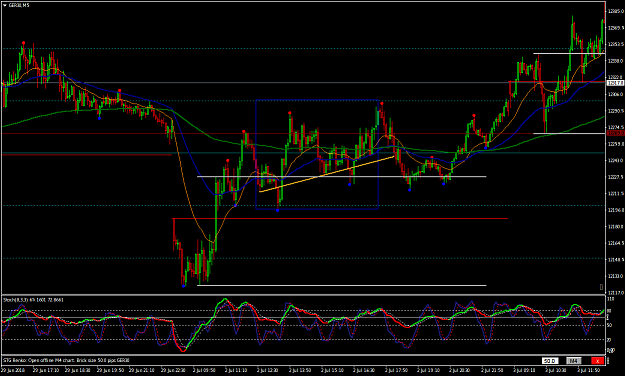
- dee50 replied Jul 4, 2018
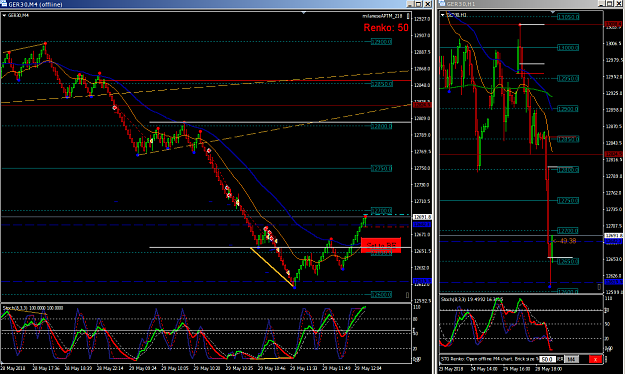
Here. All the trades happened inside the Blue Box, it was a mess to trade but that was the time I had available. I don't trade Standard Time frames I monitor the 1hr to keep an eye on what the rest of the market is looking at, in this instance I ...
More simple is impossible
- dee50 replied Jul 3, 2018
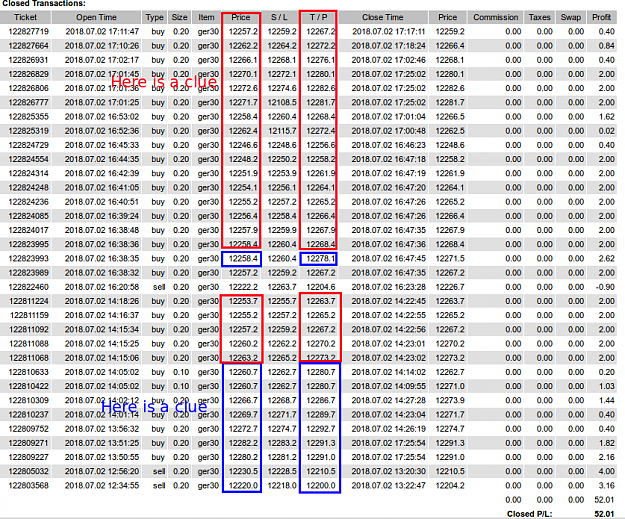
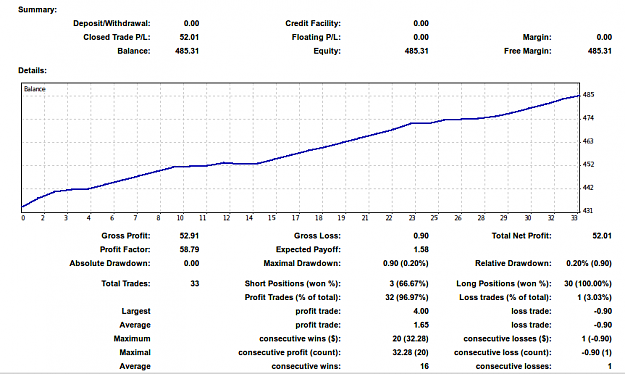
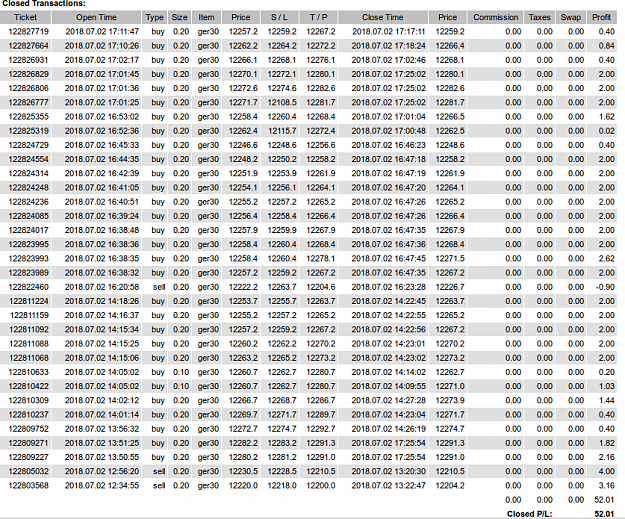
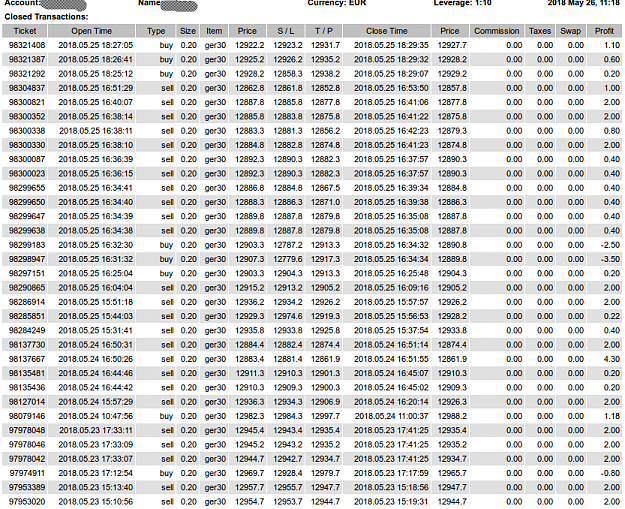
Todays result. 260 pips. Stayed with the small €100 account. Used a mix of my BE strategies and TPs as a result it is a lot of trades but with just 1 loser of -9 out of 33 trades some thing must be working! so Net Profit of 52.01 = 260 pips @ ...
More simple is impossible
- dee50 replied Jul 2, 2018
Todays result. 260 pips. Stayed with the small €100 account. Used a mix of my BE strategies and TPs as a result it is a lot of trades but with just 1 loser of -9 out of 33 trades some thing must be working! so Net Profit of 52.01 = 260 pips @ ...
More simple is impossible
- dee50 replied Jun 19, 2018
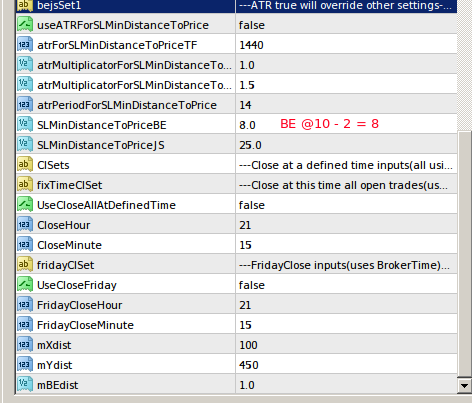
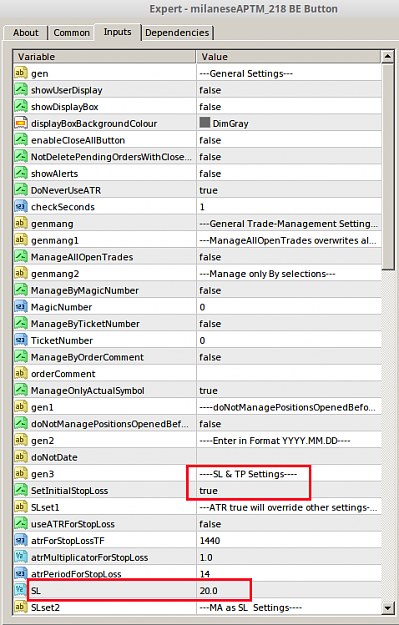
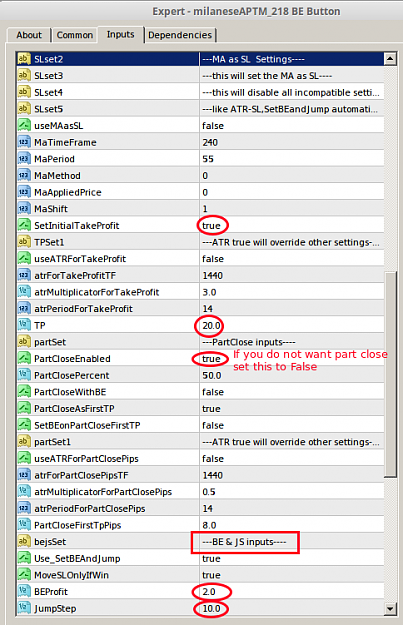
For @kooza.Image 1,2, and 3 settings for 20SL 20TP BE +2@10 take partial profit 50% @10. image 4. change these settings to change BE +? @?. here is the link to a couple of PDFs with insructions. url SETUP Exactly as shown, don't skip any settings ...
More simple is impossible

- dee50 replied Jun 11, 2018
Here is the link. Danske Bank Research Complete DISCLAIMER as shown. If you don't they will not let you in!!! image click on FOREIGN EXCHANGE, a drop down menu appears click on DANSKE TECHNICAL UPDATE image click on item image click on GO TO ...
More simple is impossible

- dee50 replied Jun 8, 2018
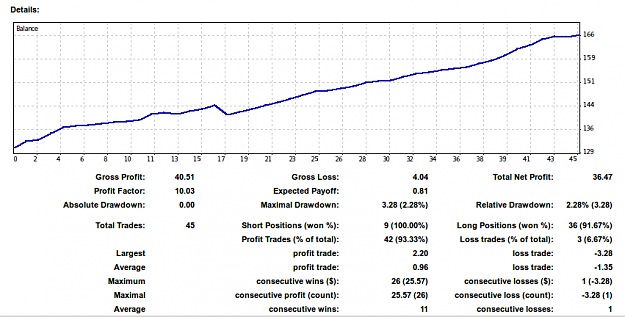
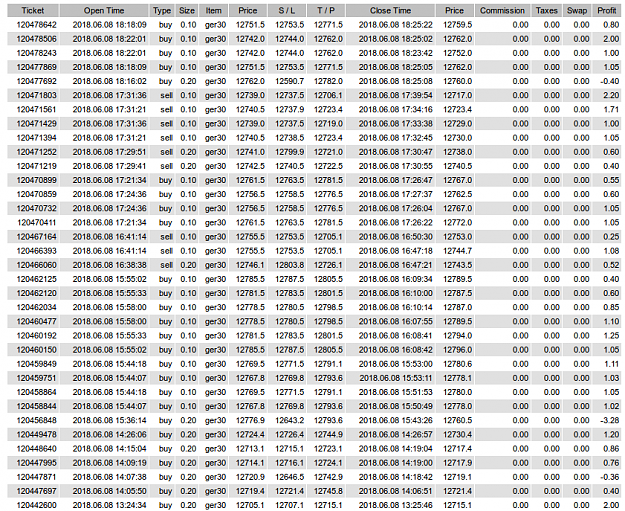
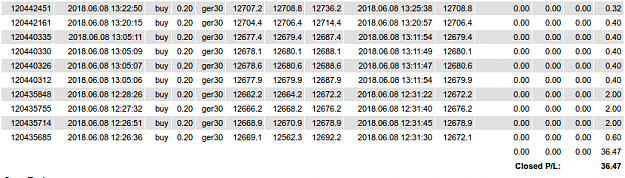
Today's trades. 1Stupid loss -16 and a couple where I did not click out fast enough = 3 losers, but the rest in profit. €36.47 net profit = 182 net Pips @ €0.20/lot I used BE+2 @5 with TP@10 the first few were fine but then I kept getting taken out ...
More simple is impossible
- dee50 replied May 31, 2018
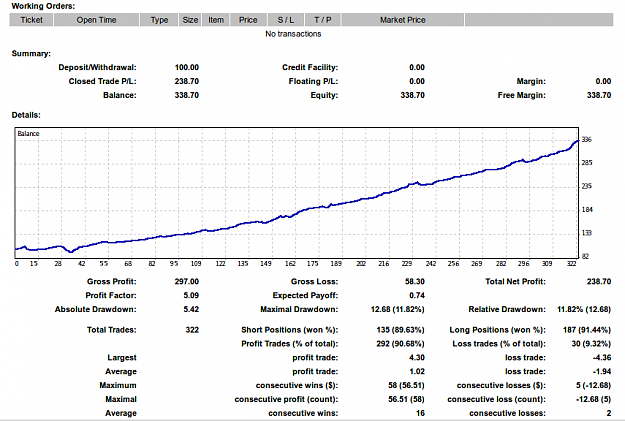
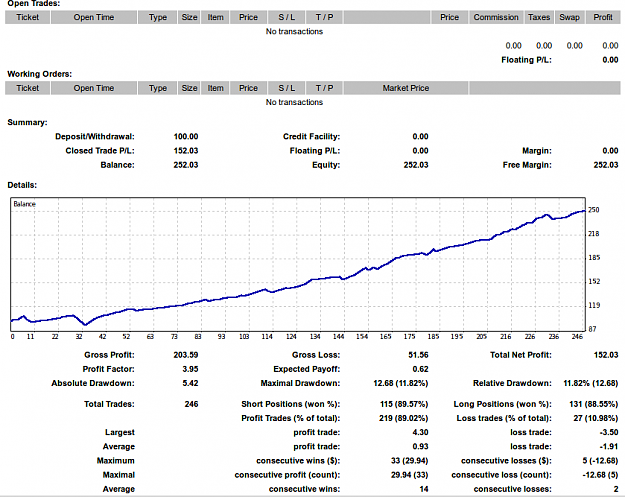
Final result of my journey into the world of the small account. 17 trading days. €100 start up, net profit €238 = approx 1,190 pips Trading small took so much pressure off that I found myself verging on reckless, I had to check myself on quite a ...
More simple is impossible
- dee50 replied May 29, 2018
It is not Rocket Science. Stop looking for Magic and just concentrate on what price is telling you. there are plenty of clues on a chart, if you can not see them on 1 time frame, look at another, if you still can not see them then it is not yet your ...
More simple is impossible
- dee50 replied May 28, 2018
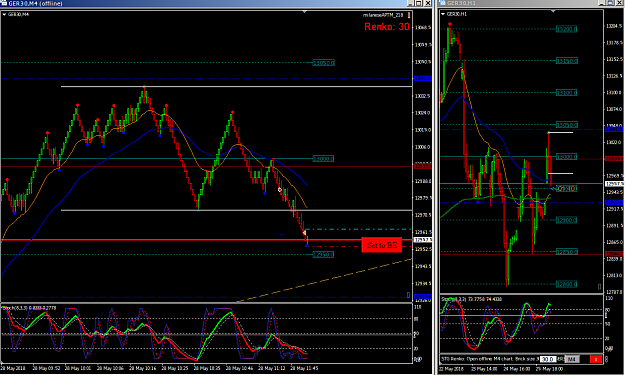
No tricks or treats. I literally just traded breakouts in the direction of the trend. But I employed Paranoid Mode, move to BE+ as quickly as possible the consequence of that is a high win low profitability rate.Trend EDIT. Here is an example +22. ...
More simple is impossible
- dee50 replied May 26, 2018
With the changes to leverage that are being implemented for EU traders I was curious about the effect on the small retail trader. I have never traded a small account before, when I started 12 years ago I started with a €25k account. I opened a €100 ...
More simple is impossible
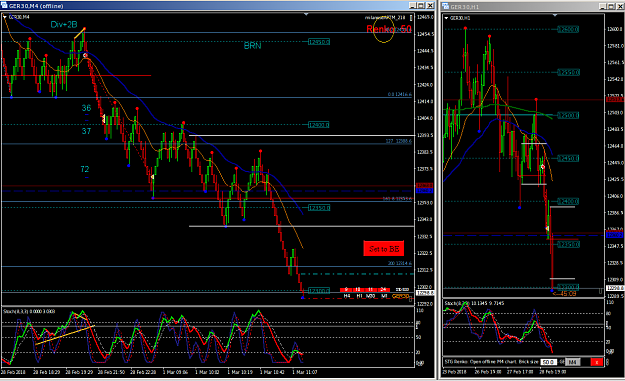
- dee50 replied Mar 1, 2018
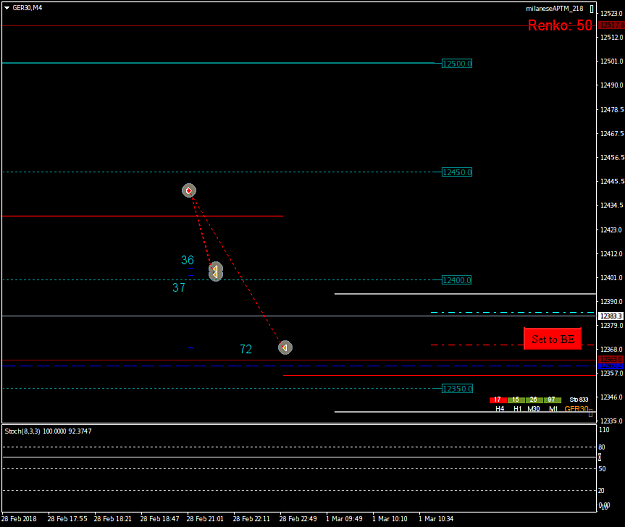
Here is the real chart. Internet connection is in the crapper we are having torrential rains and we are in the clouds so I can not risk trading. I waited and waited for a sign last night it finally came at 9.00pm. I needed an entry at a significant ...
More simple is impossible
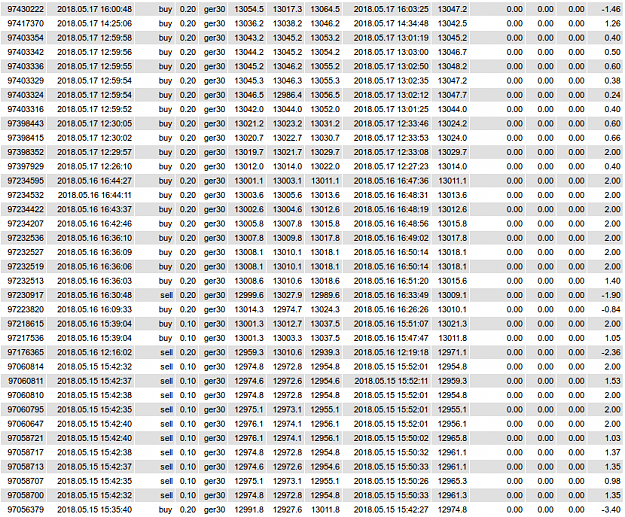
- dee50 replied Mar 1, 2018
Good point. Well said. DAX30 +36+37+72 Overnight trades. Since I got rid of all that useless information on the chart my trading has improved 100%
More simple is impossible
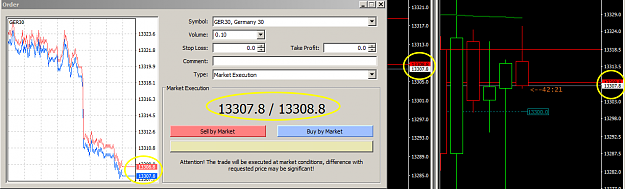
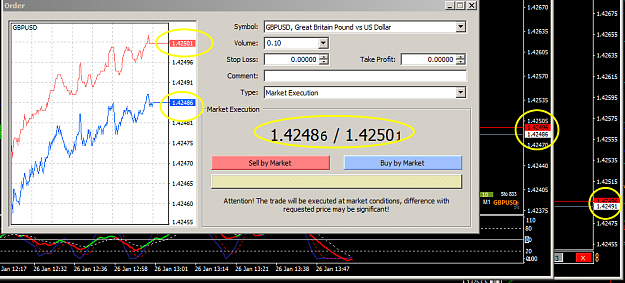
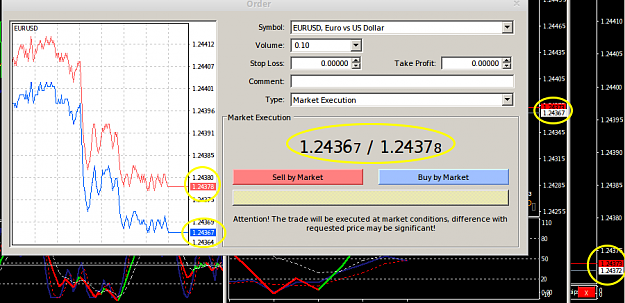
- BID/ASK prices differ on ORDER window than shown on chartsStarted Jan 27, 2018|Platform Tech|13 replies

When trading would it be logical to expect that the prices shown on one TF chart would be the same ...
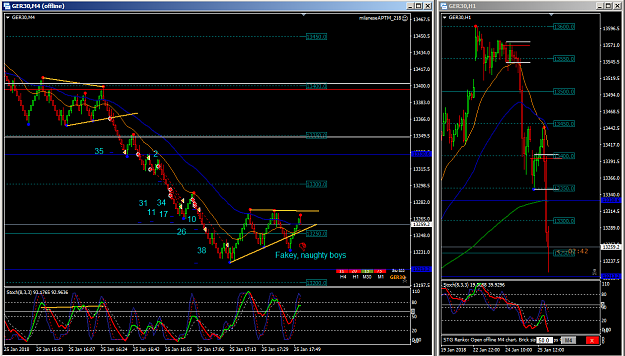
- dee50 replied Jan 25, 2018
Few from Draghi. Ger30 35+2+31+34+11+17+10+26+38.Divergence at BRN followed by a TL break started it all, no idea where it was going to stop so just kept entering and looking ahead for targets first Blue line was the HTF 200EMA not much resistance ...
More simple is impossible
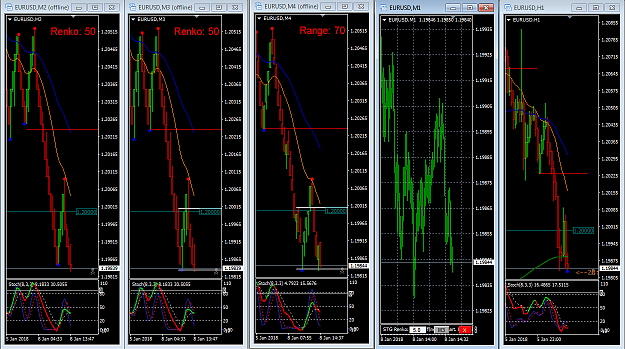
- dee50 replied Jan 8, 2018
I have posted this on Platform Tech thread, but I thought I better post it here as well as it could possibly be affecting some of you and you may not be aware. Strange thing happening. If I did not have a 1hr chart open to monitor the HTFs I would ...
More simple is impossible

- Renko Chart on Currencies different prices from RT ChartStarted Jan 8, 2018|Platform Tech|11 replies
Happy new year to all. Strange thing happening. If I did not have a 1hr chart open to monitor the ...