- Search Energy EXCH
- 230 Results

-
 dantpm replied Mar 29, 2024
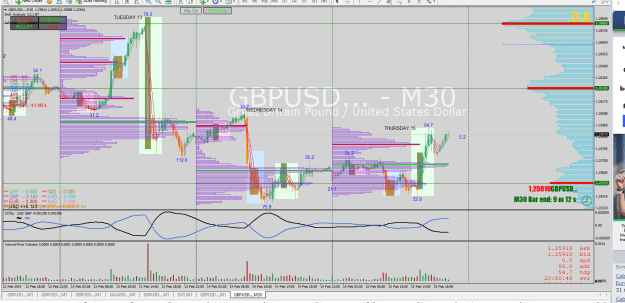
Less expensive for the market to drop price than to raise it. The caveat is that we don't know what position 'the market' currently holds.
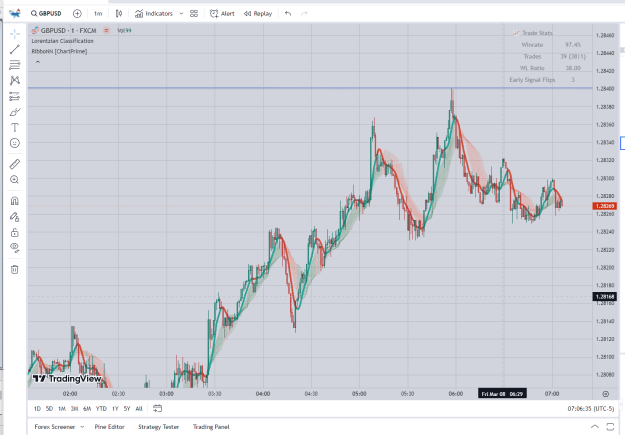
Cable Update (GBPUSD)
- dantpm replied Mar 26, 2024
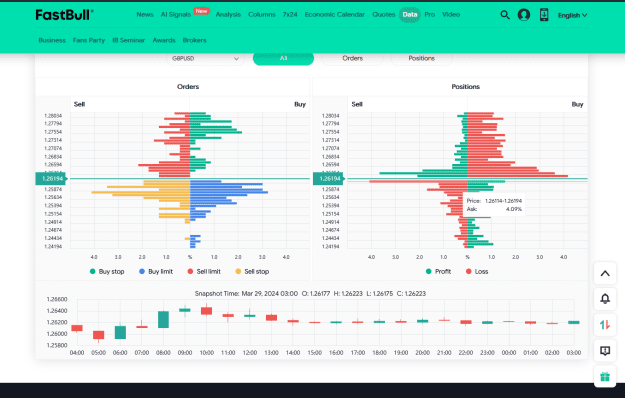
If you look at the sell positions in this chart, I believe you are looking at people hoping for this to go down. Pretty good reason not to go down just yet.
Cable Update (GBPUSD)
- dantpm replied Mar 23, 2024
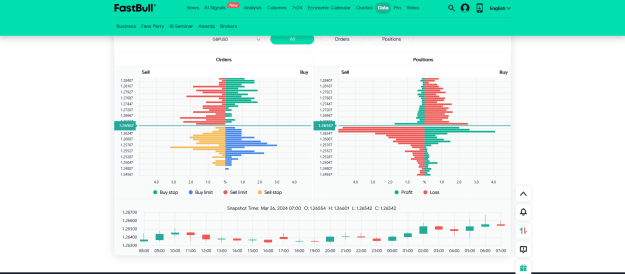
This chart is suggesting that price might want to drop...
Cable Update (GBPUSD)

- dantpm replied Mar 14, 2024
Gold and DXY aren't playing nice with GU right now. You and eyefeelsix are probably both 'right' but the timing is 'confusing' right now! my
Cable Update (GBPUSD)


- dantpm replied Mar 1, 2024
Here is an interesting chart setup from Tradingview. The basics of both indictors are pretty good. They could be a lot better! Currently the user has to set the parameters for both. It would be really useful if the indicator could set the parameters ...
I will code your EAs and Indicators for no charge
- dantpm replied Feb 28, 2024
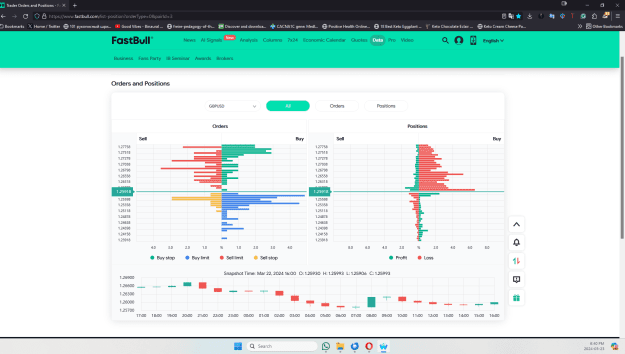
Too many traders short on US$ will probably cause a spike up on the US$ My :
Cable Update (GBPUSD)

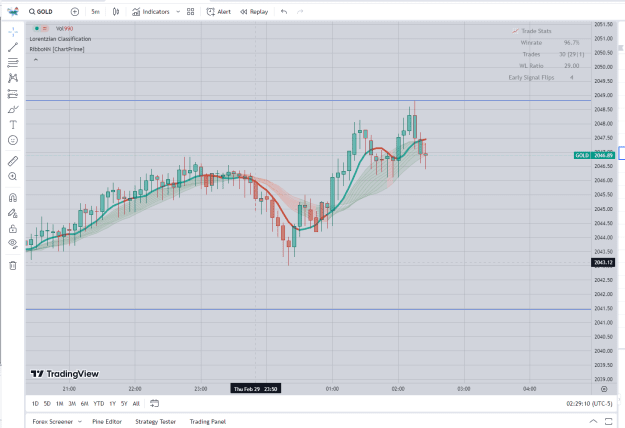
- dantpm replied Feb 27, 2024
Trading setup using two machine learning indicators from Tradingview.
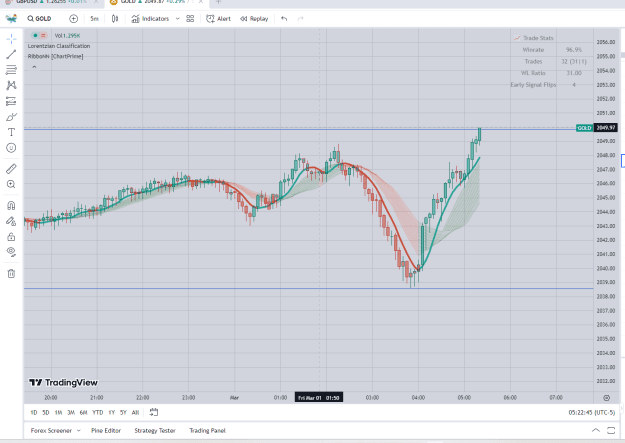
Gold


- dantpm replied Feb 27, 2024
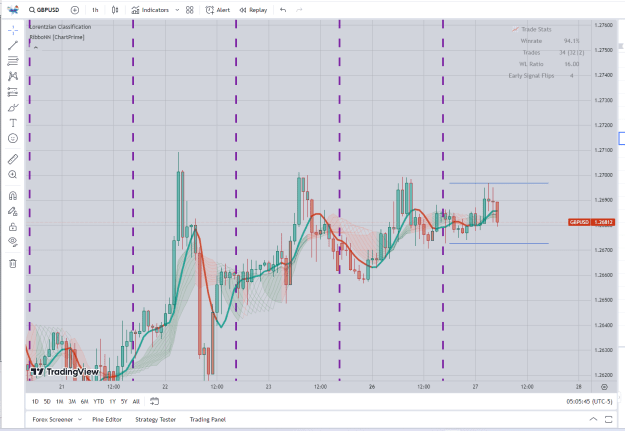
Not sure if anyone is following the Lorentzian Classification machine learning indicator, but these are impressive numbers at the 1 hr time interval!
Cable Update (GBPUSD)
- dantpm replied Feb 21, 2024
Frustrating detail about this indicator is that for every item traded and every time frame there is a slightly different setup that changes through the day. You can get by with common settings in many cases. It's too bad that [A] someone doesn't ...
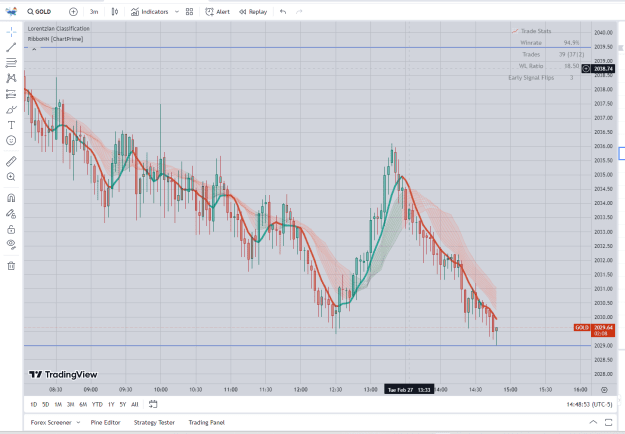
Cable Update (GBPUSD)
- dantpm replied Feb 21, 2024
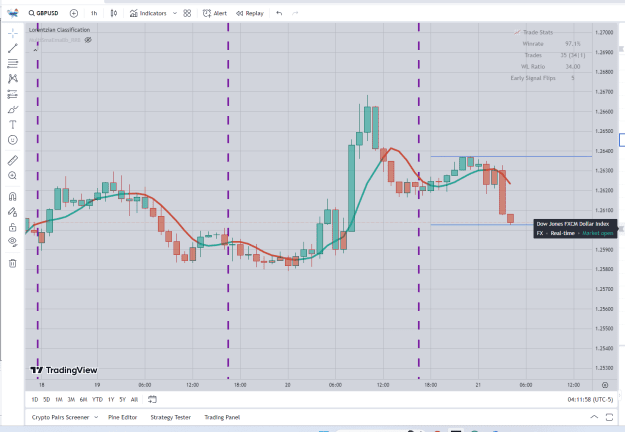
As I understand it, the way you read this is there is a 97% probability that there will be 4 red candles in the 1 hr time frame where the win loss ratio is 34:1. There are also 5 early signals in the past 50 signals. Looks like this is another one! ...
Cable Update (GBPUSD)
- dantpm replied Feb 19, 2024
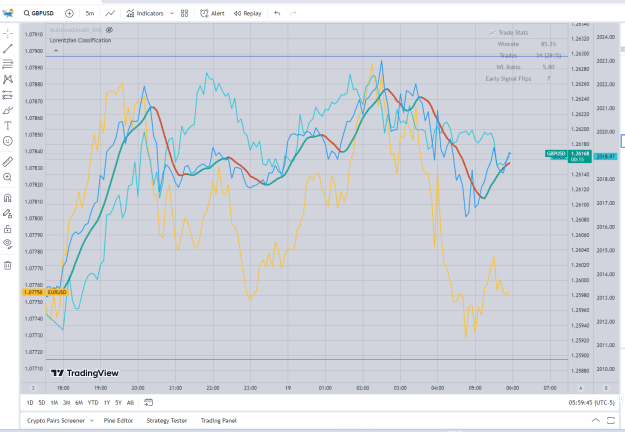
Yellow line is EURUSD, Blue GBPUSD, Turquoise Gold and the blue-red line the lorentzian moving average price. Nice demonstration of how when these align in direction you get bigger moves than when they don't align. ...
Cable Update (GBPUSD)
- dantpm replied Feb 15, 2024
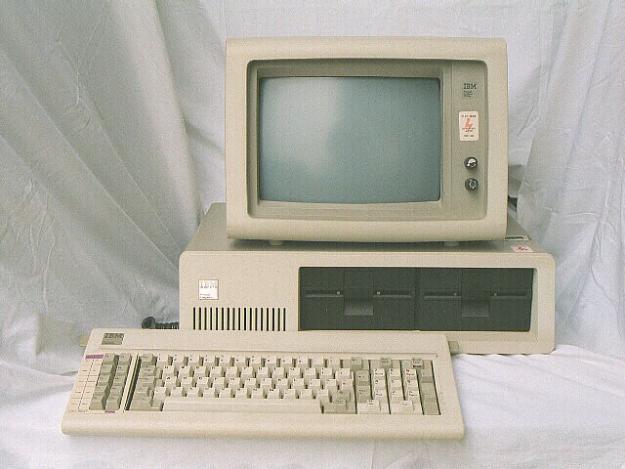
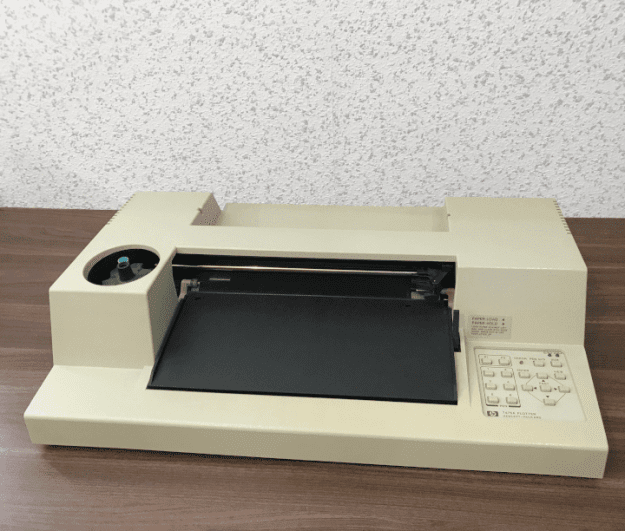
Here is the dual floppy setup with the 6 pen hp plotter. Spent hours producing charts on these for executives who simply tossed them!
Cable Update (GBPUSD)
- dantpm replied Feb 15, 2024
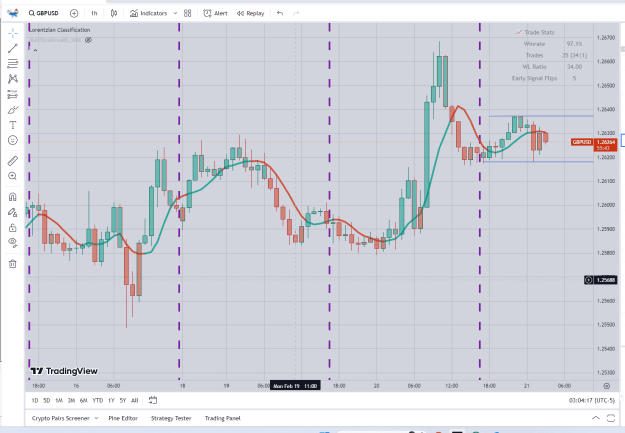
Still trying to understand these setups and how to use them correctly. Looks like there could be a bit of resistance to an upward move in GU.
Cable Update (GBPUSD)