- Search Energy EXCH
- 11 Results

- dancering replied Sep 20, 2010
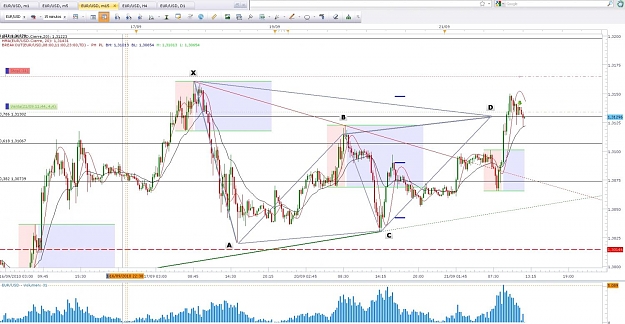
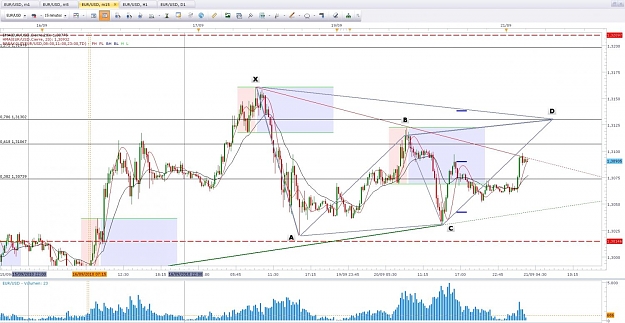
Short 1.3130 — Hi all, my view before going to bed: Once TL broked because bull flag will try to reach D then possible gartley sell pattern. (M15). Now could buy at 50% retracement 1.3080 zone.
EURUSD
- dancering replied Jul 23, 2010
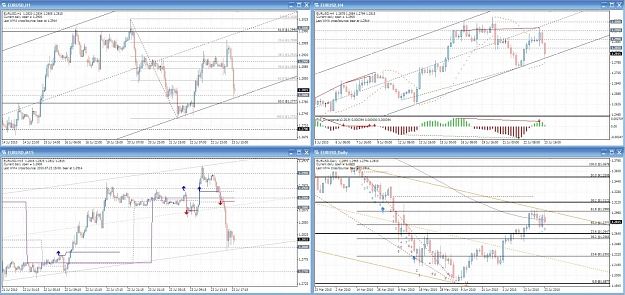
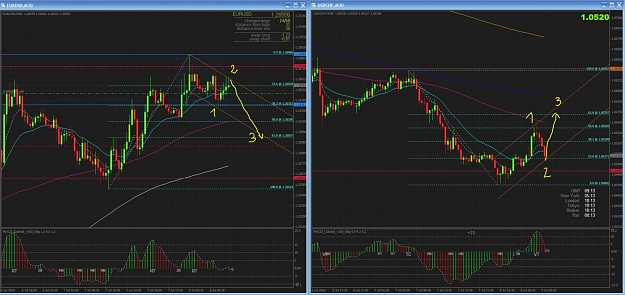
That's my view. All TF respecting LTL but Daily one, who's bouncing from UTL, also 3rd candle for a sell setup that will be invalidated if price goes higher than 1.2913. The perfect DIV on H4 was so profitable today but now better keep away from ...
EURUSD
- dancering replied Jul 15, 2010
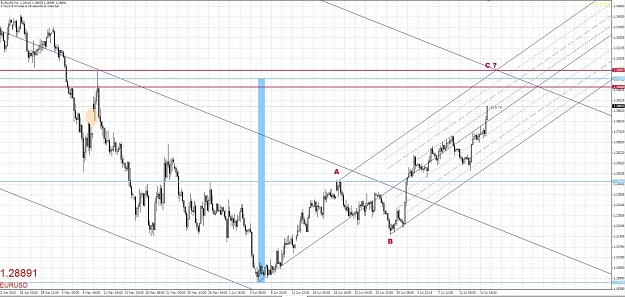
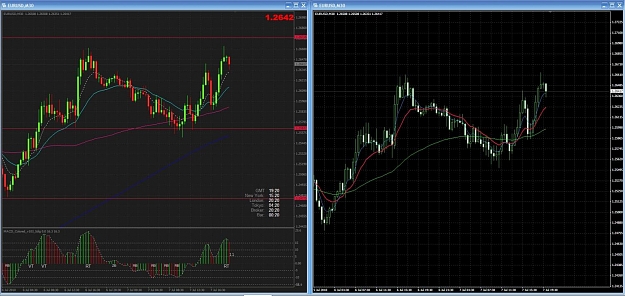
We are just cover the last big GAP from 7th till 9th May. Now we have to cover same distance from neck line from last inverse H&S what it means 1.3000 - 1.3050 (blue line), also important resistance level from last uptrend. That's my view. Any ...
EURUSD
- dancering replied Jul 8, 2010
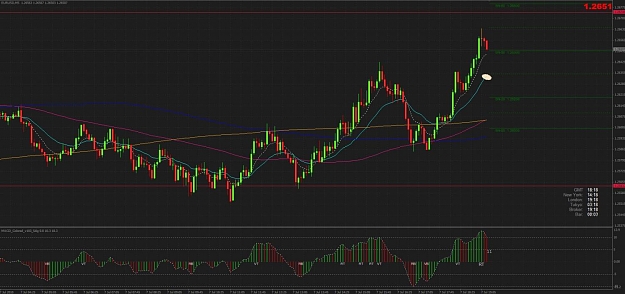
Here's another setup. Invalidate if cross resistance level 1.2665 - 75. Will see in 30min.
EURUSD
- dancering replied Jul 7, 2010
After compare I still think EMA21 (BLUE) holds better than EMA13 (RED), you can see on chart. Anyway, thx for advice, will try for different strategy. Thx
EURUSD
- dancering replied Jul 7, 2010
Thx, it was +55pips. I also think trend will continue but now watching Round Top and see if bouncing till EMA21. Good luck!.
EURUSD
- dancering replied Jul 5, 2010
Holding TL — That's my setup, hope TL holds well as it did till now.
EURUSD
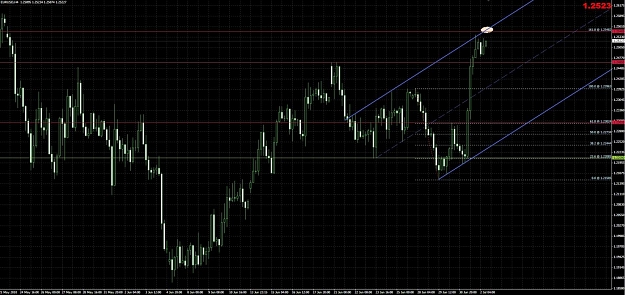
- dancering replied Jul 2, 2010
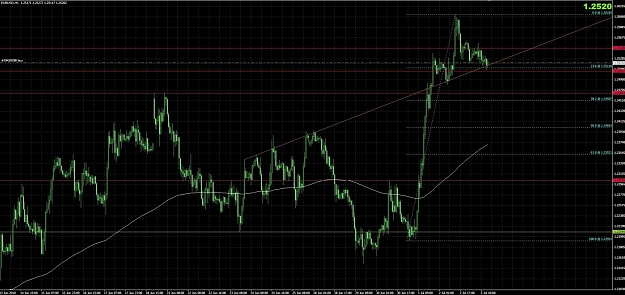
That's my view. 1.2550 TP because 168% Fib and Top H4 uptrend and wait if reverse or fly to sky. Will see, too early to know sure.
EURUSD
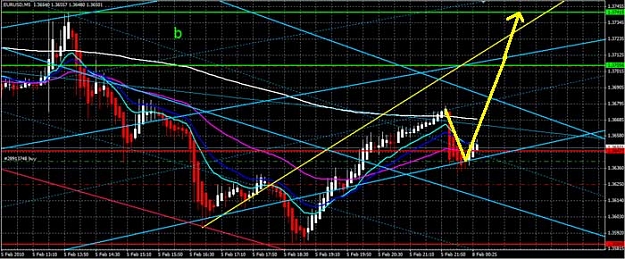
- dancering replied Feb 7, 2010
Hi, going long from 1.3646, SL 1.3625, TP's 1.3705 & 1.3741. If price cross 1.3682 the strategy will be confirmed because change to the upper channel bands. If trend change to 1.3647 and not back will be invalidated. Any opinions?
EURUSD
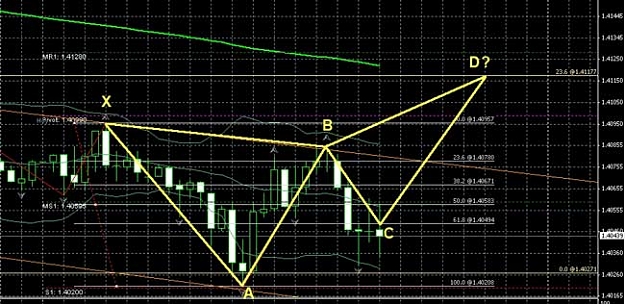
- dancering replied Jan 27, 2010
Anyone can confirm if this bearish butterfly pattern is right on M30 ? Thx. image
EURUSD
- Posts by Member Search: 'dancering'