- Search Energy EXCH
- 24 Results
- corvogrigio replied Nov 4, 2014
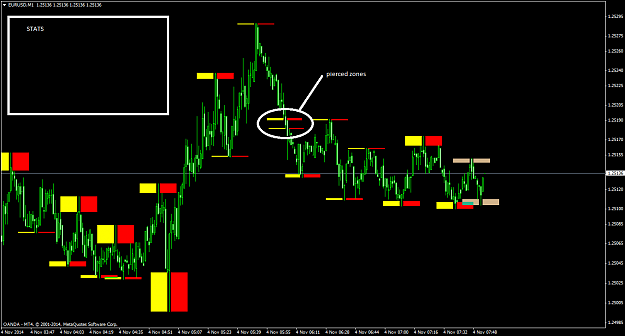
Hi Xixi...nice job and thank you very much for sharing your indy.... I'm wondering if you can exclude the zones that I called "pierced zones", in the attached picture, and add stats (like in Firefox indy) or at least to have stats counting the only ...
The similarity system
- corvogrigio replied Oct 14, 2014
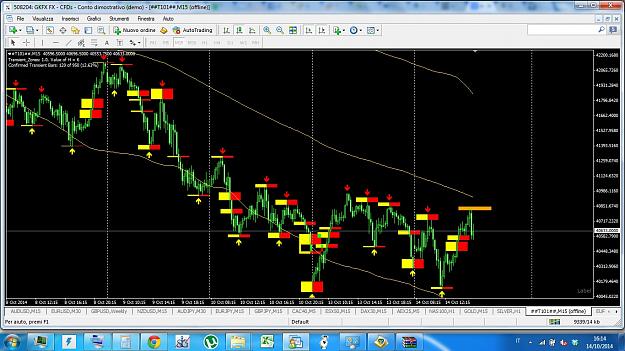
Hello ....the attached picture shows a synthetic index made of a basket of 4 indexes (CAC40 dax 30 esx50 aex25) but you can put in whatever is in MT4 My idea was to apply the concept of Transient Zones to a ratio of two correlated indexes (gold and ...
The similarity system
- corvogrigio replied Mar 22, 2012
ADD ON Possible ? — Hello SHAA , PARADOX and other kind coders in here! HELP! As I'm forced (because of lack of time) to be interested in H4 t.frame, I'd love to have , while my screen is at max zoom out in M15, a small preview of candles in ...
Extreme TMA System
- corvogrigio replied Mar 9, 2012
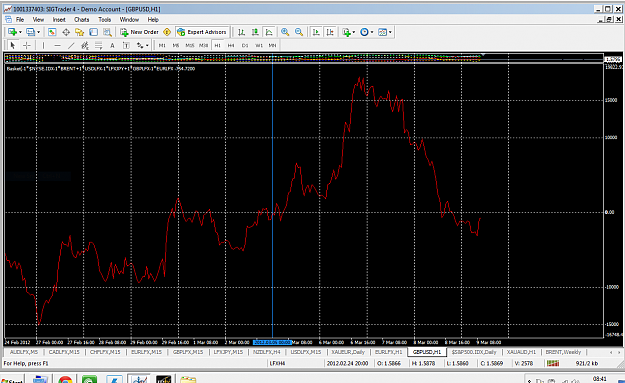
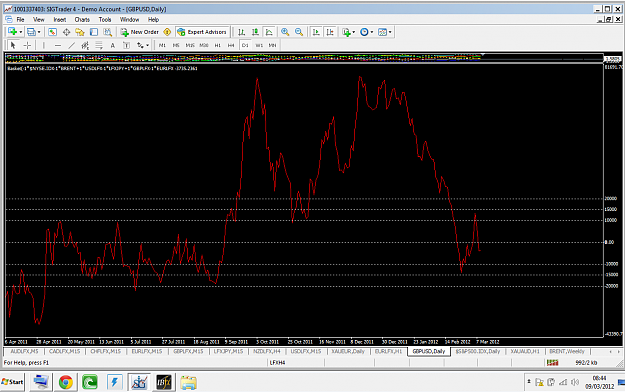
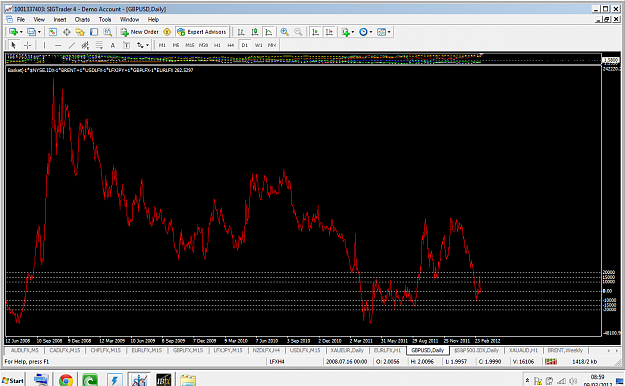
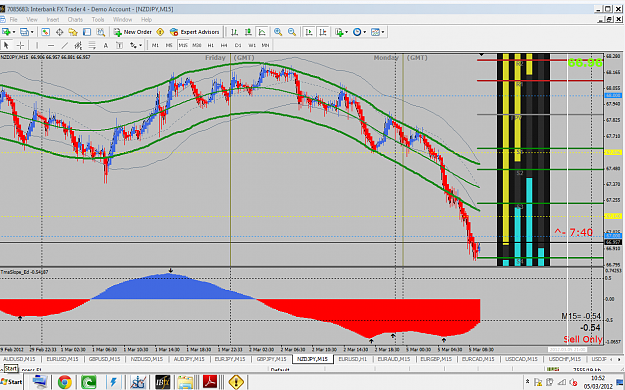
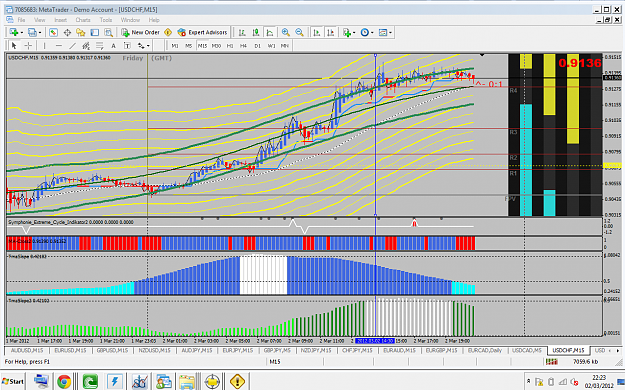
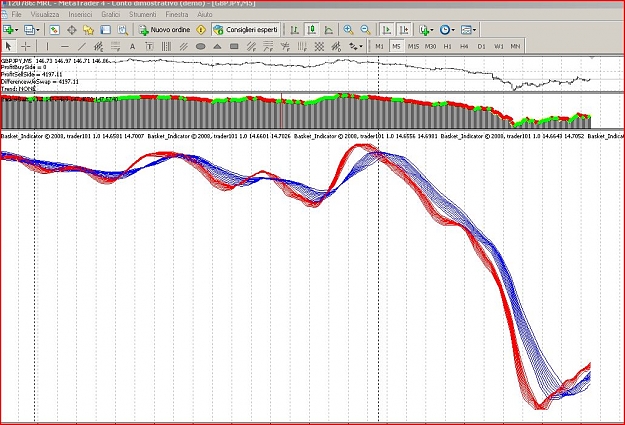
RISK OFF/ON — G morn AL! I attache 3 screen shots of a kind of indicator I built up (on Sigtrader) after you exposed what is usually going up n down in the risk off periods. I used a basket indicator (basket profit sq2) where I put . on the ...
Extreme TMA System
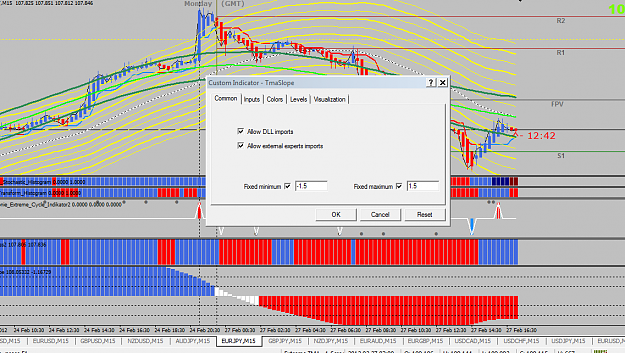
- corvogrigio replied Mar 8, 2012
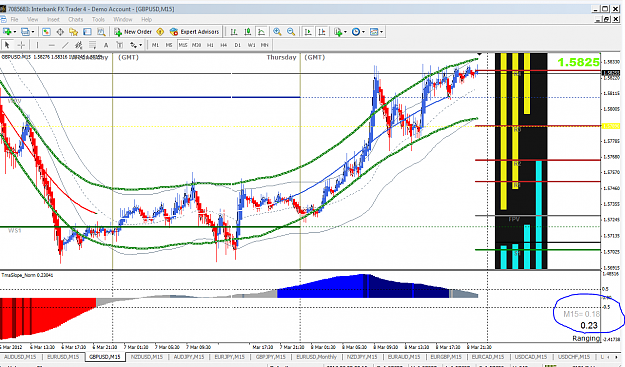
Problem with tma slope 1.4 normalized — I attach a screenshot.....there s something not working properly in it. I got two different values of the slope (1.4 normalized)....while I stay in M15 the the 2 values don't match each other ..look in ...
Extreme TMA System
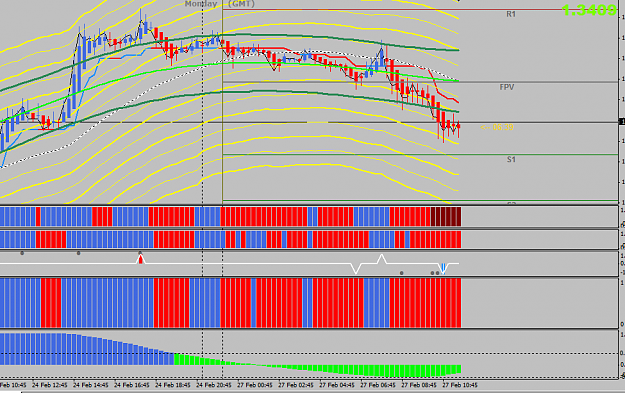
- corvogrigio replied Mar 2, 2012
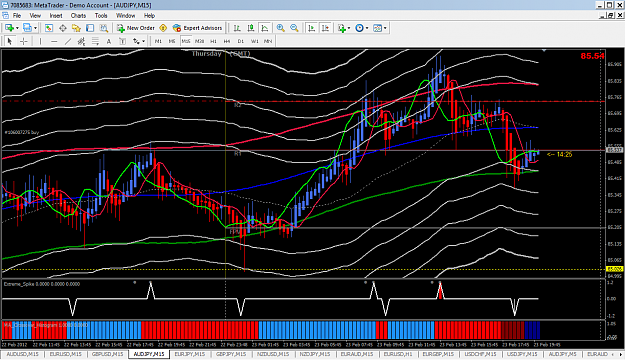
Ouch this is what i have comparing non repainting with regular slope, it looks pretty different
Extreme TMA System ( the one in the bottom is the non repainting one) It would have crossed 0.5 line at 14:30 gmt (as per my graph)
- corvogrigio replied Mar 1, 2012
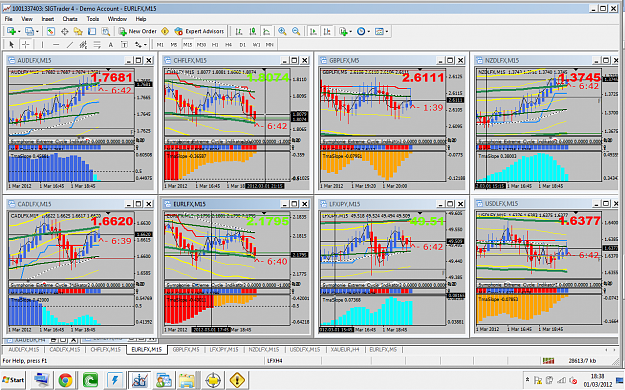
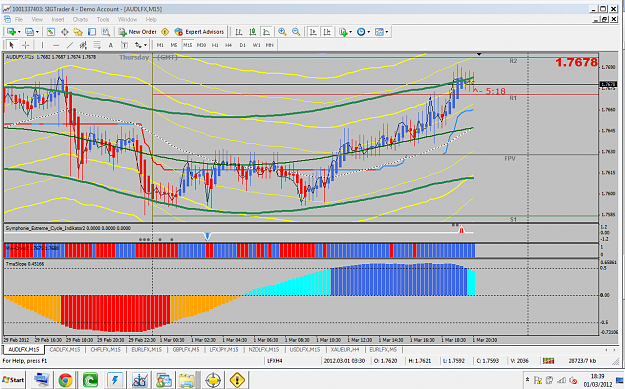
Scanning THE MARKET — I want to show you my idea 4 scanning the market and see force/weakness of currencies. I remember that someone mentioned this broker (SIGTRADER) that has these indexes created with correlation between the 8 most common ...
Extreme TMA System
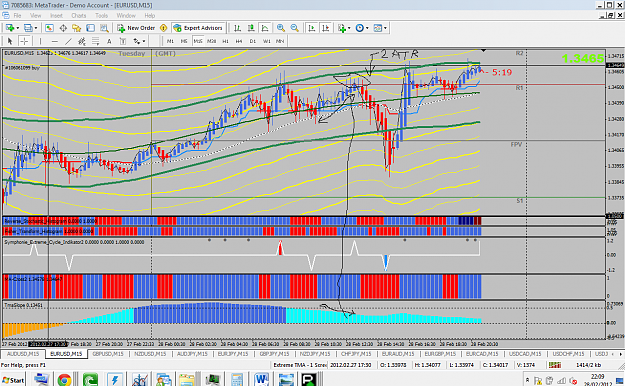
- corvogrigio replied Feb 28, 2012
Yes and I'd add that the down move started at the 1st retest of the 2atr TMA band, while a bear spike appeared! the more I watch this the more I like.
Extreme TMA System
- corvogrigio replied Feb 27, 2012
Maybe you must try this setting or something similar....
Extreme TMA System
- corvogrigio replied Feb 27, 2012
And about the way to measure how far we are from the TMA regular band (the lower one in this case) it shows that in EU we touched the 4th lower band recently
Extreme TMA System
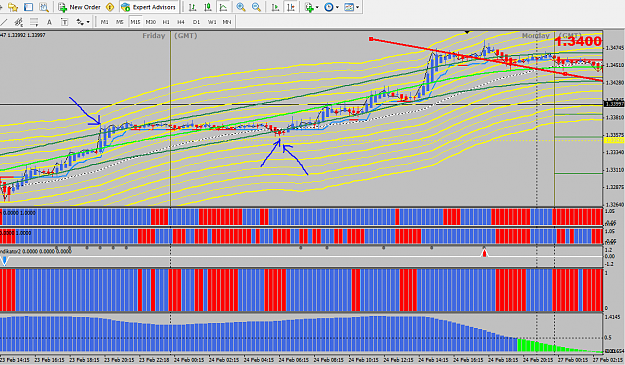
- corvogrigio replied Feb 27, 2012
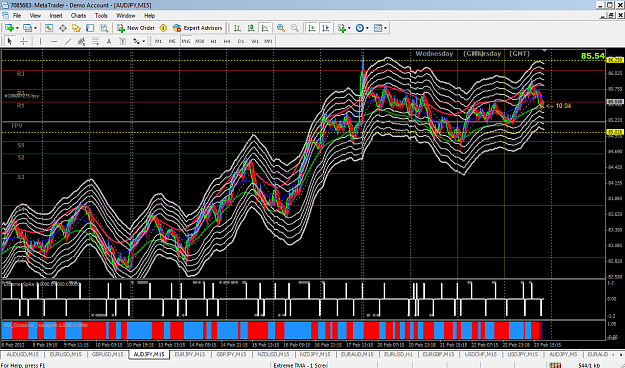
"A" Formation — Hi Al! welcome back I'd like you want to give a glance to the pic. In my TPl i overlayied 8 upper and lower bands with TMA TRUE This shows that price (while it was substantially still ) "moved" from the 4th upper band ...
Extreme TMA System
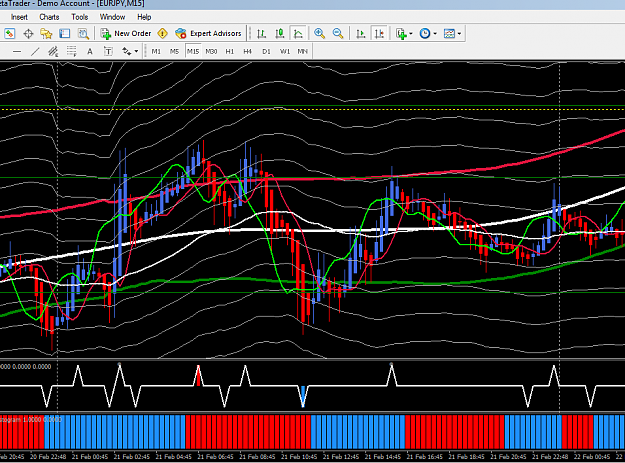
- corvogrigio replied Feb 24, 2012
TO ALEX84 — Hi Alex! Can you tell me, please, the exact gmt time you took that short on EUR/JPY ? I'd like to see if this set of TMA true (I attache a snapshot) can help to understand reasons of this bad trade . Thank you in advance
Extreme TMA System
- corvogrigio replied Feb 23, 2012
How far? — Hi Al ! I revenge the matter I was among the firsts to declare I was onboard with you!
Extreme TMA System (you were exposing something I'm was looking for, since years) I definetly join with compliments about ur system but mostly about your way to ...
- corvogrigio replied Oct 16, 2008
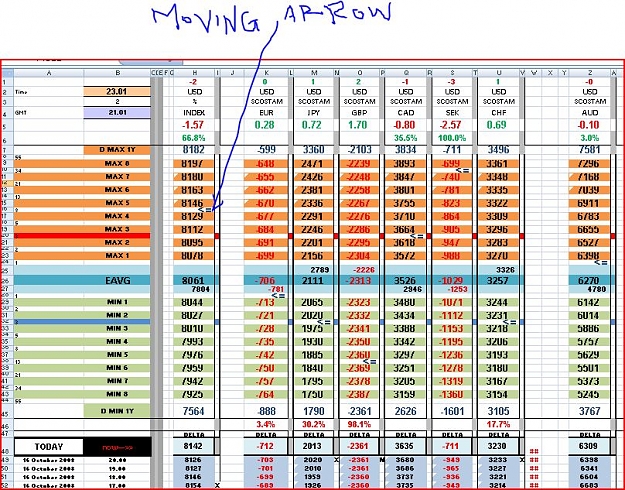
again abou US$index — Hey Jul, yes i composed the US$ adding usd/eur (reversing eur/usd) usd/yen usd/gbp usdcad usdsek and usdchf with this percent respectively 57.6% 13.6% 11.9% 9.1% 4.2% 3.6%--- I want to add anothe snapshot of another sheet ...
Signals for Simplicity
- corvogrigio replied Oct 16, 2008
US$index in the basket?? — Hi Julius and all! While Luke (Hndymann) is working on my excel spread sheet to push it to a 24 hours track with 15 mins timeframe ( a medal to him 4 this hard work he is doing helping me because of my lack of time) ...
Signals for Simplicity
- corvogrigio replied Oct 9, 2008
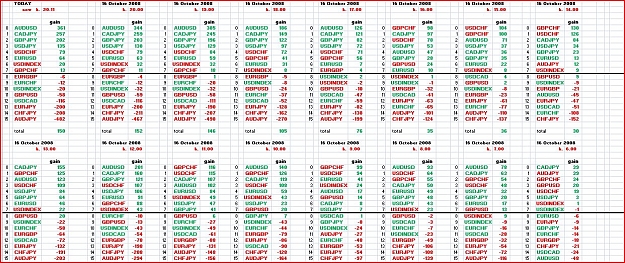
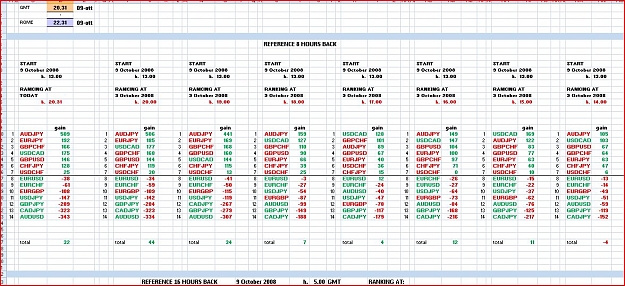
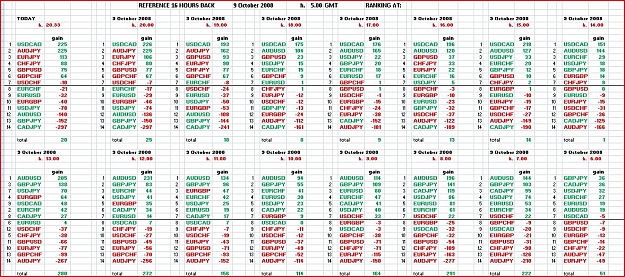
2 more snapshots — updated snapshot of 8 hours back and new snapshot of 16 hours back on 16 hours it becomes more clear the walk of pairs...doesnt it? Notice: the left upper column the most recent DATA, the right lower the earliest ONES
Signals for Simplicity
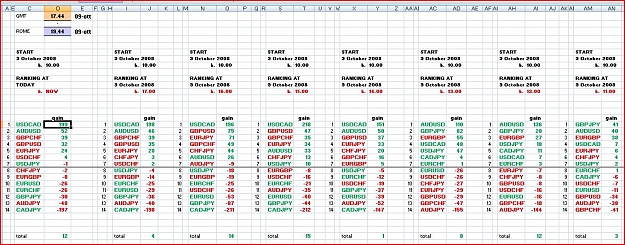
- corvogrigio replied Oct 9, 2008
Pairs Ranking Track By Excel — Hi Julius and all T101ers! I couldnt follow the 3d today as i wanted to be in full immersion in starting to build this new spreadsheet...well i got it though there is a lot of work to do. I attache a snapshot of ...
Signals for Simplicity
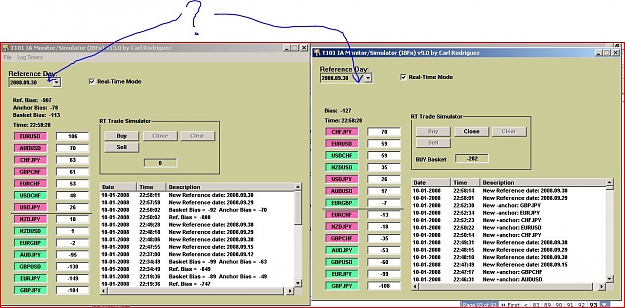
- corvogrigio replied Oct 1, 2008
TO Crodzilla — Hi CArl While ,as all here, I greatly appreciate ur great work and i thank u 4 that, though I noticed something strange: The two versions gives different numbers though the reference date is the same This happens only on the ...
T101 external IA Monitor