- Search Energy EXCH
- 84 Results (1 Thread , 83 Replies )
-
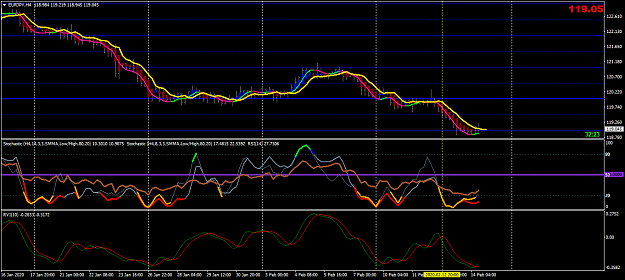
 bythepound replied Feb 14, 2020
40Pips - Try to only pick entries where the stochastic lines are touching, or almost touching, and moving in the same direction. Pointing between 12-2 or 4-6 o'clock is best. This suggest strong momentum in the move. I use the RVI (Relative Vigor ...
Trading Made Simple(r)
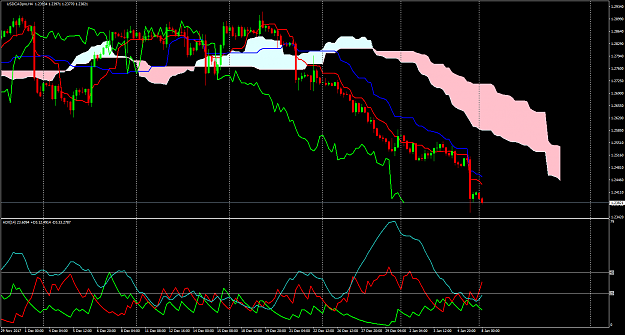
- bythepound replied Jan 29, 2020
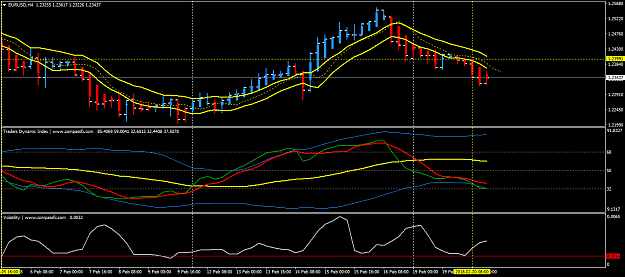
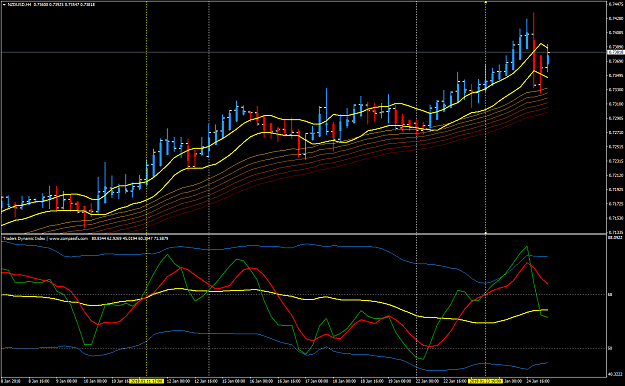
Today's NZD/CAD trade on the daily TF - entered at the vertical yellow line (a little late). I use the TDI as an exit indicator only.
Trading Made Simple(r)
- bythepound replied Jan 28, 2020
I would stop trading the 1 HR TF and focus on the 4 HR, but better yet the Daily. There is less chop. Also, look for setups where the Stochastic lines are very close, I mean VERY close and moving in the same direction. Look at your EA chart from the ...
Trading Made Simple(r)
- bythepound replied Feb 21, 2018
@Emmanuel - thanks for the analysis above. I have been looking at the OHLC data of H4 charts that you mention above. Good stuff. I have also been trying to locate these multi TF charts. Do you have a link?
Trading Made Simple
- bythepound replied Feb 16, 2018
@Emmanuel, I am still getting the hang of taking trades based on the engulfing candle method. I marked these charts with a yellow line with my interpretation of the "rules" in this case. Are these valid and would you have/have not chosen the same ...
Trading Made Simple
- bythepound replied Feb 2, 2018
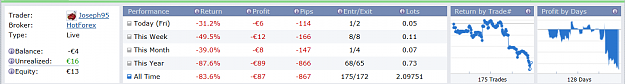
@Joseph95, Are the trade results on your trade explorer for the past 30 days directly related to this thread's trading method? I know you say to disregard the results because it's an old TE that you are trying to recover, but I assume the trades ...
I challenge you to fail with this
- bythepound replied Feb 1, 2018
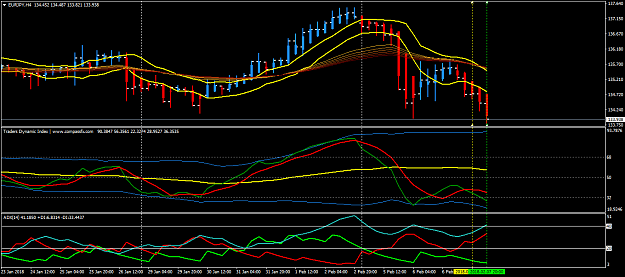
Live trades closed today. My loser was on the E/G because I failed to adjust my stop as the trade became profitable. The E/U was a small gain after running up and then coming down to hit BE. Entries at vertical yellow, exits at second vertical line. ...
Trading Made Simple
- bythepound replied Jan 25, 2018
Onejester, you might apply a multiple moving average like the ones in my posts and see if that may have helped. MMAs are just a tool to help show the trend. They are not perfect but they seem to help filter bad trades while still offering plenty of ...
Trading Made Simple
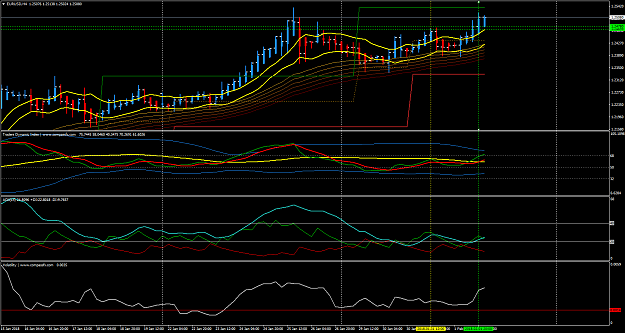
- bythepound replied Jan 25, 2018
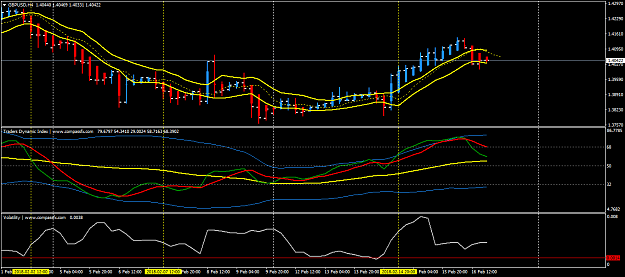
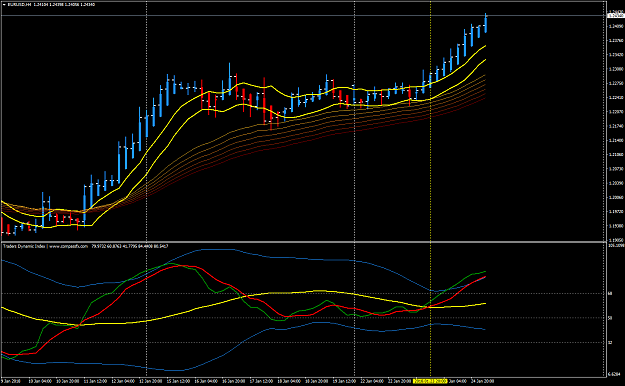
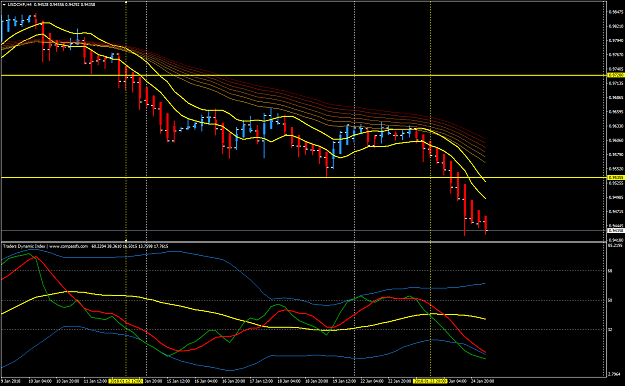
Here's another entry on the USD/CAD. Note the first short break of the PAC (RED LINE) failed resulting in a big drawdown - BUT look at the TDI, there was no momentum. These quick reversals on the TDI are riskier and so wait until there is good ...
Trading Made Simple
- bythepound replied Jan 25, 2018
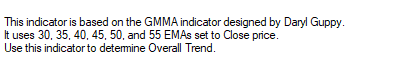
I use the following settings to for my multiple moving averages - fairly common.
Trading Made Simple
- bythepound replied Jan 24, 2018
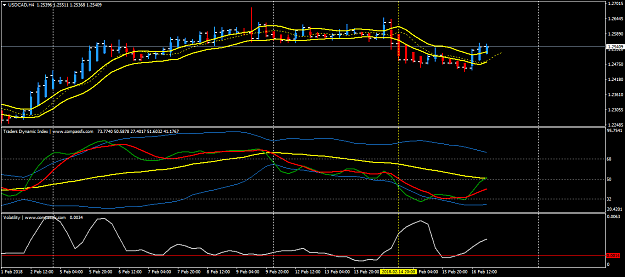
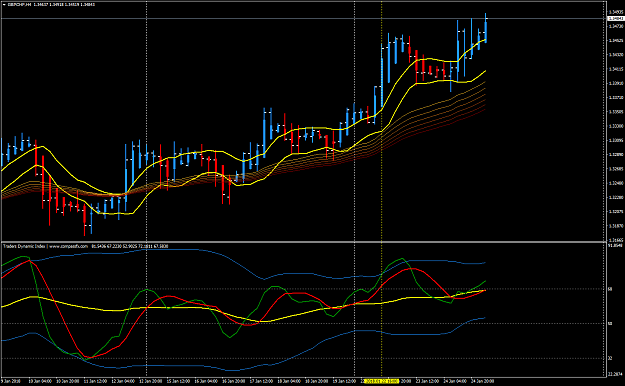
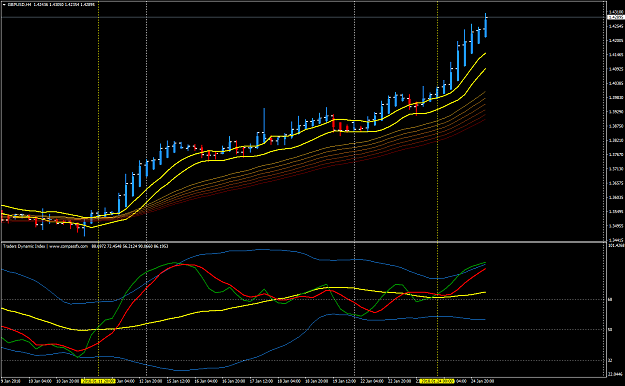
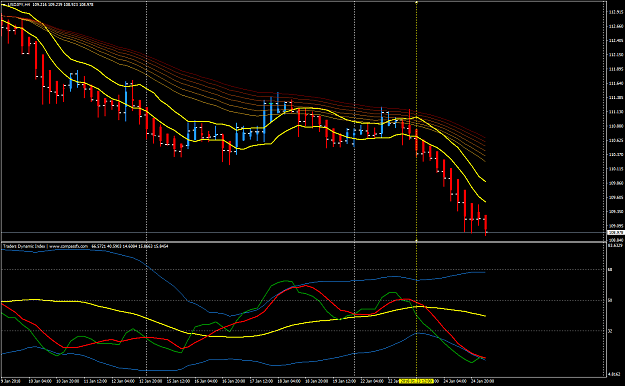
Here are a few other entries using the multiple moving average (MMA) with good momentum on the TDI. Note any entries against the MMA would have failed. Many of the good entries happened after a pullback or test of PAC in the direction of the trend. ...
Trading Made Simple
- bythepound replied Jan 24, 2018
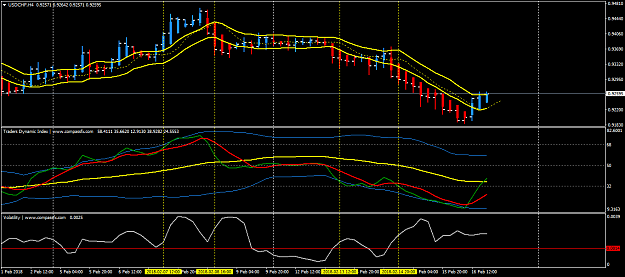
In support of what Emmanuel said, you can remove the training wheels (TDI), but I still like to use the TDI as confirmation of price direction and strength of that move as evidenced by the angle of the TDI, and not necessarily an entry signal since ...
Trading Made Simple
- bythepound replied Jan 14, 2018
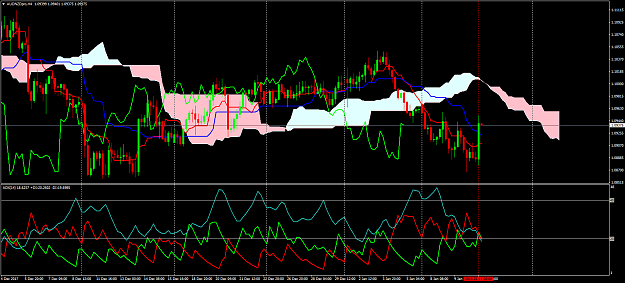
BROKER: Forex.com PAIR: AUD/NZD POSITION: SELL TIME: January 7, 2018 at approximately 20:00 PST – 04:00 chart time LOTS: .01 ENTRY PRICE: 1.0296 (at yellow vertical line) EXIT PRICE: 1.0296 (at red vertical line) PIPS GAIN/LOSS: +4 DOLLARS ...
(binned per thread starter's request) IchimokuFX - Ichimoku Kink
- bythepound replied Jan 14, 2018
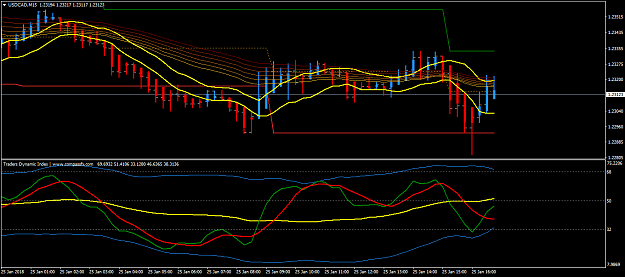
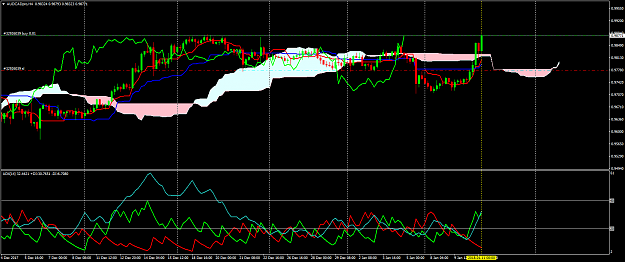
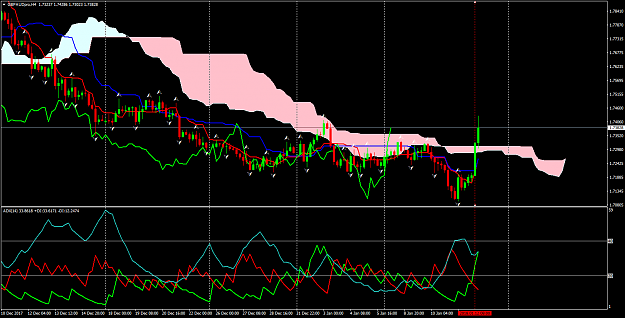
BROKER: Forex.com PAIR: AUD/CAD POSITION: LONG TIME: January 10, 2018 at approximately 16:00 PST – 00:00 chart time LOTS: .01 ENTRY PRICE: 98.75 (at yellow vertical line) EXIT PRICE: 98.78 (at green vertical line) PIPS GAIN/LOSS: +2 DOLLARS ...
(binned per thread starter's request) IchimokuFX - Ichimoku Kink
- bythepound replied Jan 14, 2018
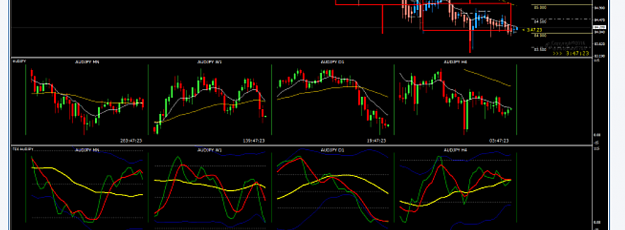
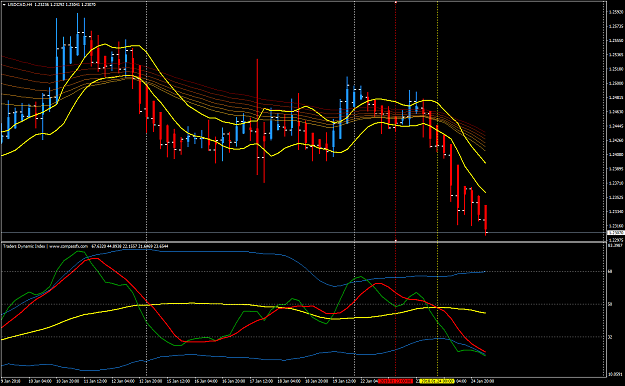
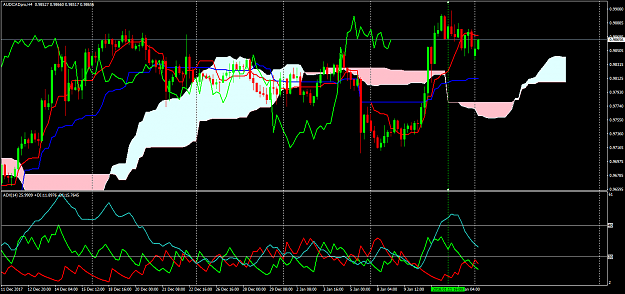
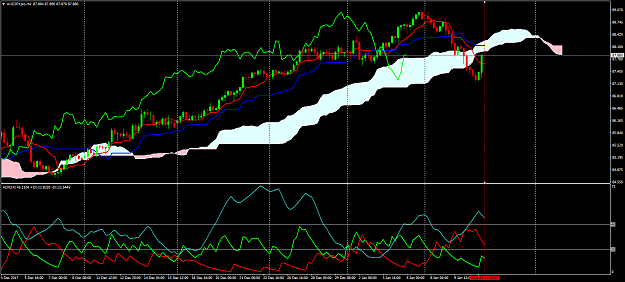
BROKER: Forex.com PAIR: AUD/JPY POSITION: SHORT TIME: January 10, 2018 at approximately 06:00 PST – 12:00 chart time LOTS: .01 ENTRY PRICE: 87.41 (at yellow vertical line) EXIT PRICE: 87.89 (at red vertical line) PIPS GAIN/LOSS: -48 DOLLARS ...
(binned per thread starter's request) IchimokuFX - Ichimoku Kink
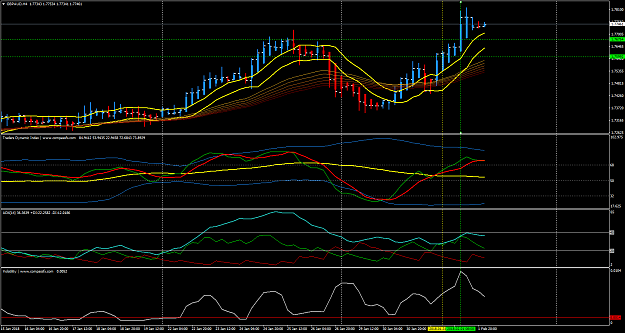
- bythepound replied Jan 14, 2018
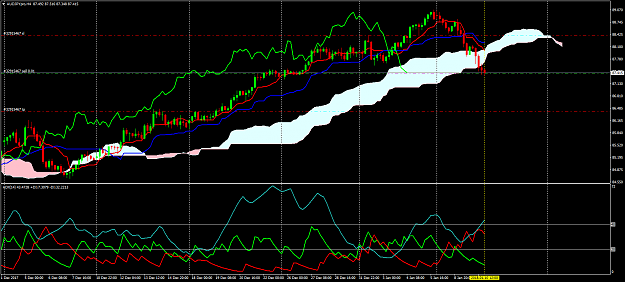
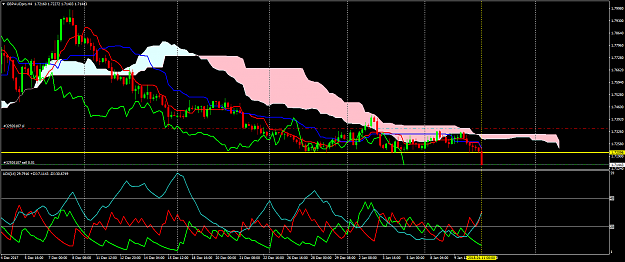
BROKER: Forex.com PAIR: GBP/AUD POSITION: SHORT TIME: January 10, 2018 at approximately 16:00 PST – 00:00 chart time LOTS: .01 ENTRY PRICE: 1.7114 (at yellow vertical line) EXIT PRICE: 1.7264 (at red vertical line) PIPS GAIN/LOSS: -120 DOLLARS ...
(binned per thread starter's request) IchimokuFX - Ichimoku Kink
- bythepound replied Jan 10, 2018
Emmanuel, What is your thought on taking trades with confirmation of MMA indicators? The one attached is from Dean Malone. Thanks BTP
Trading Made Simple
- (binned per thread starter's request) IchimokuFX - Ichimoku KinkStarted Jan 7, 2018|Recycle Bin|4 replies

Hello Traders! Having been an active trader since 2005, I have come across many trading methods, ...