- Search Energy EXCH
- 78 Results (1 Thread , 77 Replies )
- bootsyjam replied Feb 10, 2014
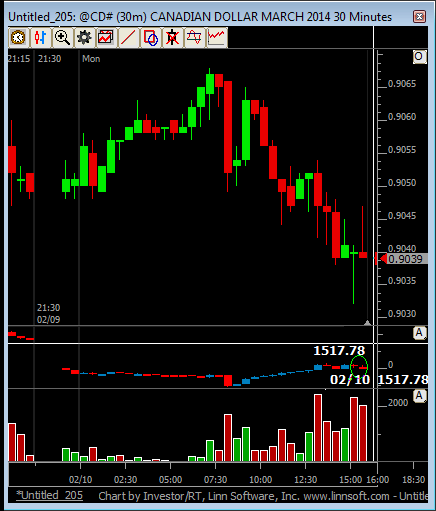
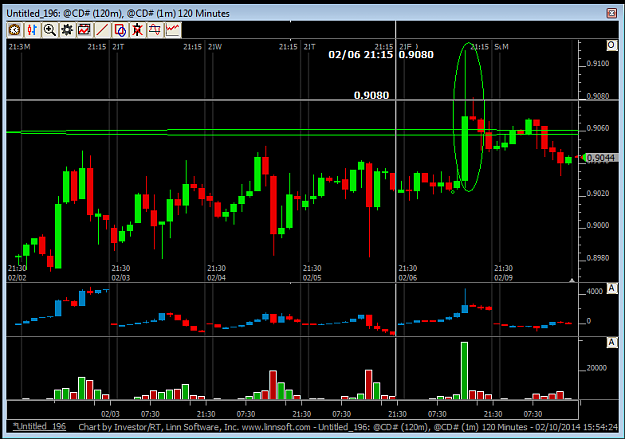
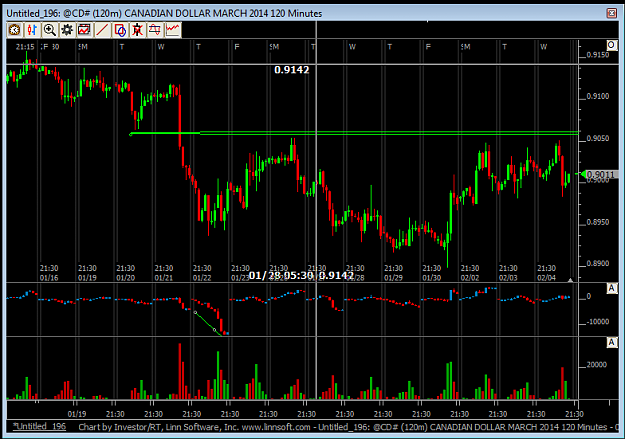
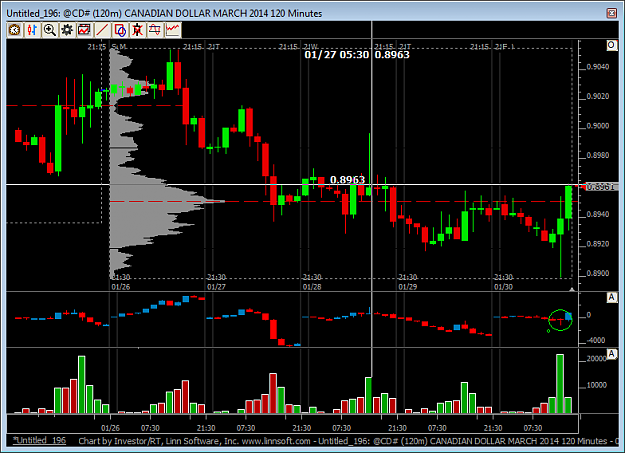
USD CAD short. Price has moved into the price volume bar circled in the 2 hour chart. Pin bar on 30 min chart-I'm in. Note that the cumulative delta shows that there was, on balance, a slightly negative amount of buying in the market here. So the ...
Spot Fx Trades based on futures volume and price movement
- bootsyjam replied Feb 10, 2014
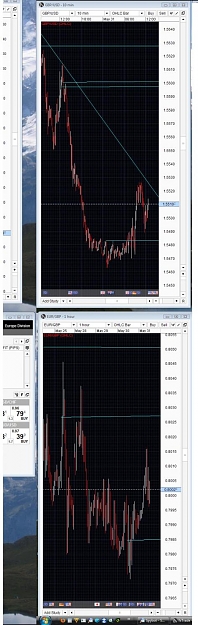
GBUSD Is up close to levels where buyers previously came in and were proved wrong so I expect them to be closing these positions by selling-looks like this has happened and the price has had the brakes applied. Price retraced into the previous ...
Spot Fx Trades based on futures volume and price movement
- bootsyjam replied Feb 7, 2014
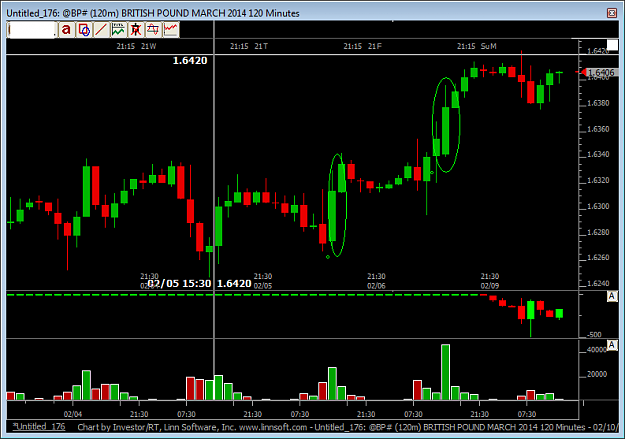
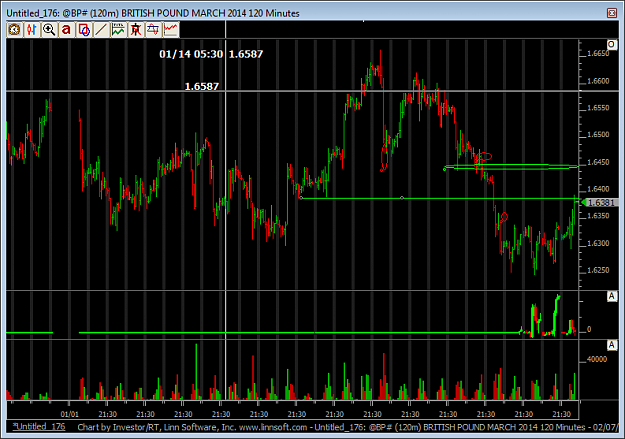
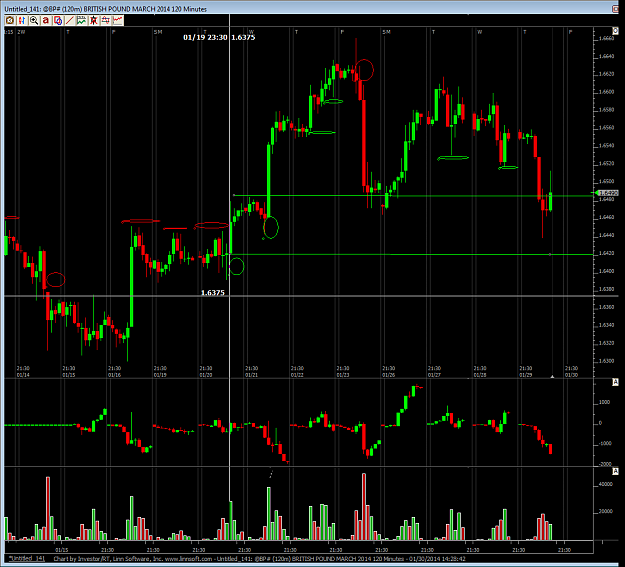
I expect gbusd to make it to the large green oval area in chart. This was the last time there was buying of any significance so I expect a reaction at this level as those who were long at this level liquidate their open shorts to close at break ...
Spot Fx Trades based on futures volume and price movement
- bootsyjam replied Feb 7, 2014
GBUSD thoughts today Big new this afternoon. Price is stuck in a base-has been pinging in a channel for last few days showing that some sort of interest is buidling. Whether it is to sell short from this level or to go long-who knows. One ...
Spot Fx Trades based on futures volume and price movement

- bootsyjam replied Feb 7, 2014
[edit] apologies once again for the random crosshair in the chart! Although it is fortuunate that it's resting on an area of interest anyway but still-rather annoying]. First up-a few thoughts about trading, indicators and psychology. I'm the ...
Spot Fx Trades based on futures volume and price movement
- bootsyjam replied Feb 6, 2014
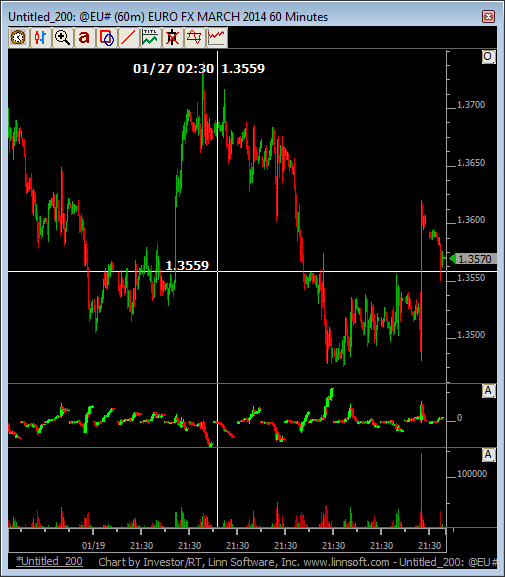
As mentioned in post 14, EURUSD went higher today. Sadly it took some warbling from the ECB to act as a catalyst making it untradeable unless you have nerves of steel. I entered a small long on GBUSD due to worse than expected USD news today and ...
Spot Fx Trades based on futures volume and price movement
- bootsyjam replied Feb 5, 2014
Further to my USCAD thoughts, have taken a small short position at 1.1100 near the top of the channel (bottom of channel on futures chart). Looking for price to bust through to 1.100. Stop set at 1.125 so approx 3.8 RR. Let's see.
Spot Fx Trades based on futures volume and price movement
- bootsyjam replied Feb 5, 2014
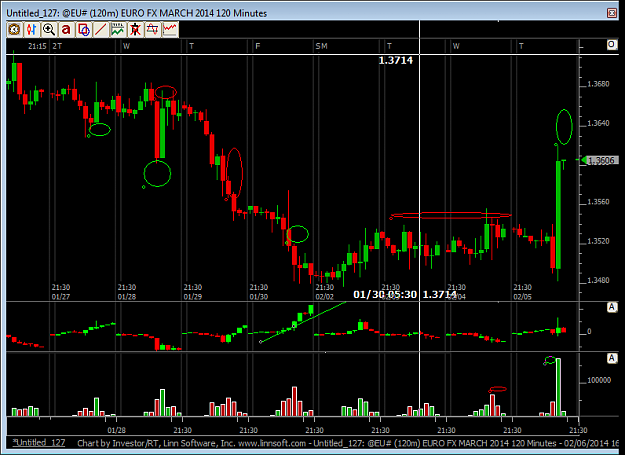
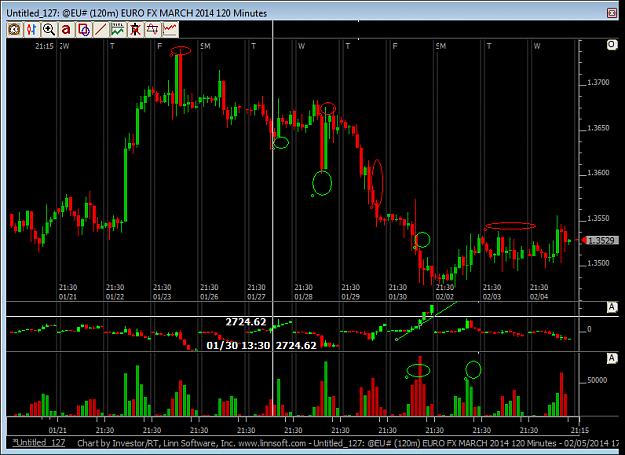
EURUSD Bit of a mash this one-posting more to muse than to show a clear trade. Looks like there has been heavy buying as shown by the green trend line under cumulative delta. This has been in the face of good but certainly not strong selling volume ...
Spot Fx Trades based on futures volume and price movement
- bootsyjam replied Feb 5, 2014
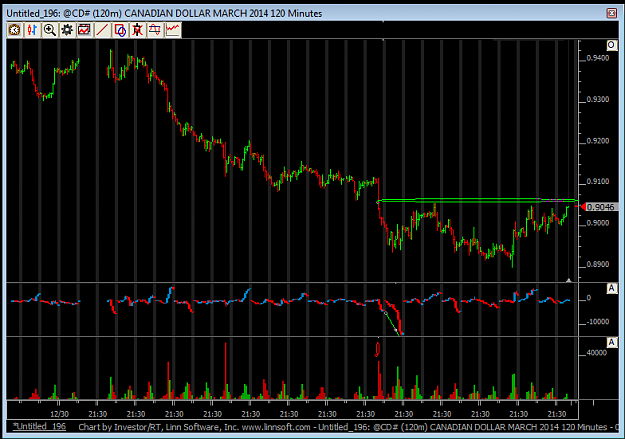
Please refer to chart in Post 9 as a starter to this thread. Please see chart below for an update. The large green oval drawn across the price shows where the tipping point is. In post 9, I showed where the supply/demand had changed and that there ...
Spot Fx Trades based on futures volume and price movement
- bootsyjam replied Feb 4, 2014
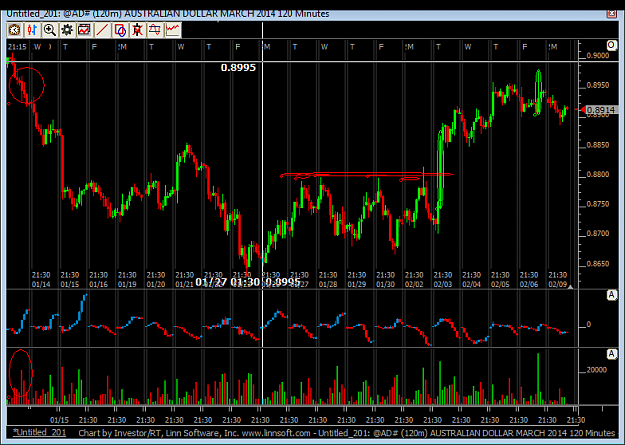
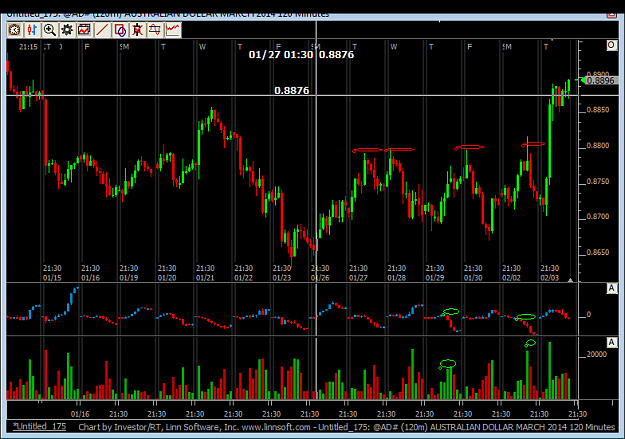
[edit] apologies for the random crosshair in the chart-it does not signify anything Been ill for the last few days-not been trading. See chart for AUD/USD. Price has broken out of the range. Whilst there were clues that it was going to do so, can't ...
Spot Fx Trades based on futures volume and price movement
- bootsyjam replied Jan 31, 2014
Live trading idea. Wonder why I'm interested? USCAD-note futures market is reversed for Cad so a long on the chart is a short on spot fx. Is taking off-have limit order to open at 1.1178 but not sure it'll get filled at all. Note the cumulative ...
Spot Fx Trades based on futures volume and price movement
- bootsyjam replied Jan 31, 2014
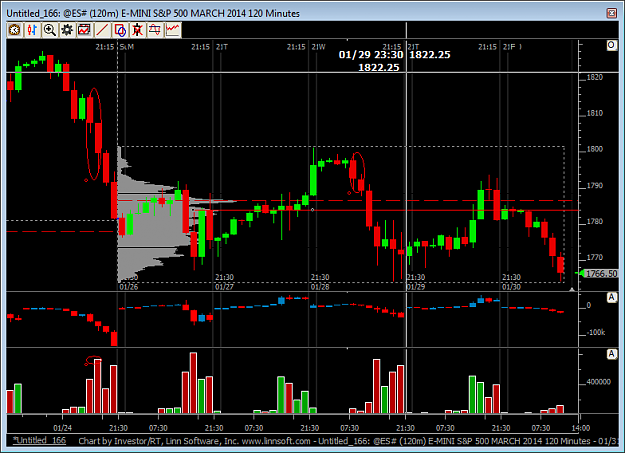
Here is sandp analysis for you (in hindsight-yay!). Look at the couple of bars circled on the left hand side-a sharp drop with good combined volume. So I know there are orders waiting to be hit somewhere in this area when price returns to it. Price ...
Spot Fx Trades based on futures volume and price movement
- bootsyjam replied Jan 31, 2014
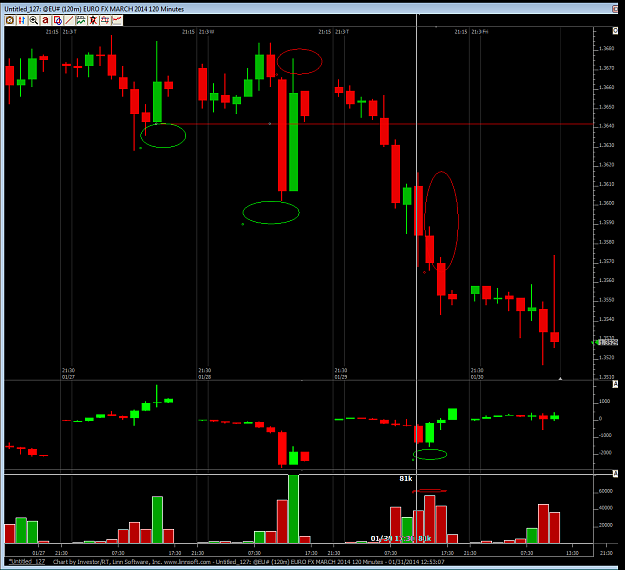
Look at chart posted below-I didn't trade this as it was too quick but it provides a great insight into how price really works. Look at the bars that have been circled/marked on the far right of the chart. You'll see high volume (nothing massive but ...
Spot Fx Trades based on futures volume and price movement
- bootsyjam replied Jan 30, 2014
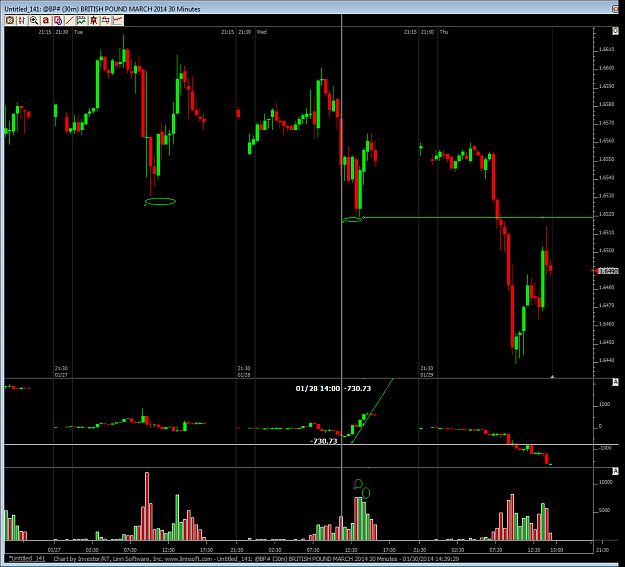
As I was typing all that out, price has come close to the possible 1.6526 reversal point and dropped. Have posted 30min chart below. Look at the volume-have circled 2 30 min nodules showing high volume. The fact that this was buying volume is shown ...
Spot Fx Trades based on futures volume and price movement
- Spot Fx Trades based on futures volume and price movementStarted Jan 30, 2014|Trading Journals|22 replies
Posting every day to help order my thoughts and post levels that I'm interested in. Main trading ...
- bootsyjam replied Jul 9, 2012
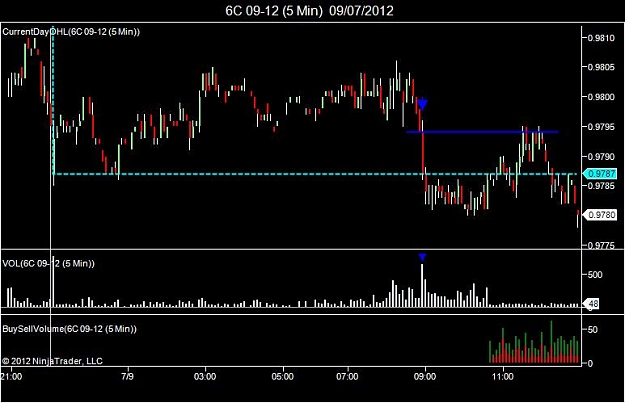
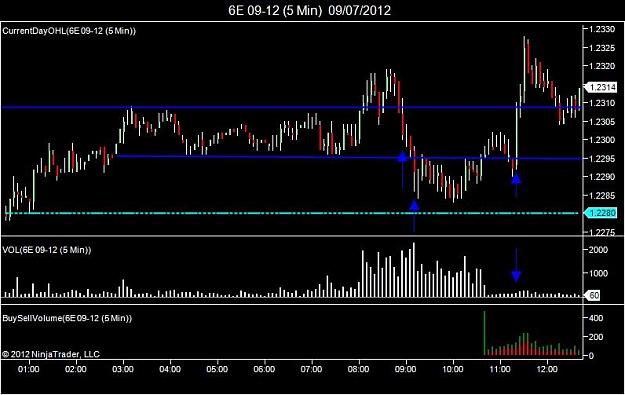
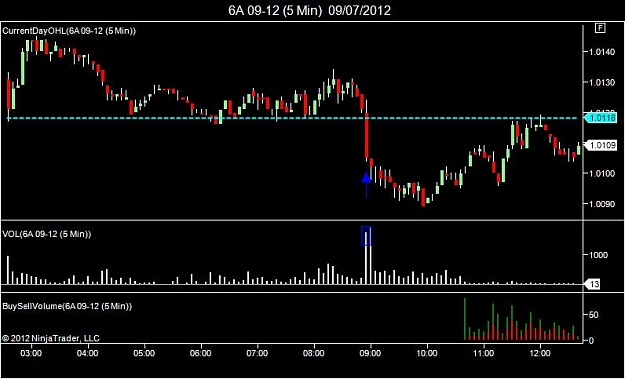
usdcad chart as per prev message — I should add that these are 5 minute charts and not 30 minute charts so it is a bit different from Ken's 30 min tf, but the same principles apply. The increase in volume for eurusd at the bottom of the move, ...
B.S. Trading with Kenneth Lee
- bootsyjam replied Jul 9, 2012
Quick question r.e .supply and demand.... — But don't you need to see actual volume in order to accurately assess whether there is real demand that has pushed prices? Have switched over to futures as I can see volume data and it makes a huge ...
B.S. Trading with Kenneth Lee
- bootsyjam replied May 31, 2012
Thanks for the update Romant. Not good conditions today, all countertrend moves so am a bit wary. GBUSD moved into a demand area earlier in the session and shot back up but I didn't enter as the initial move higher before the retrace didn't seem ...
B.S. Trading with Kenneth Lee
- bootsyjam replied May 28, 2012
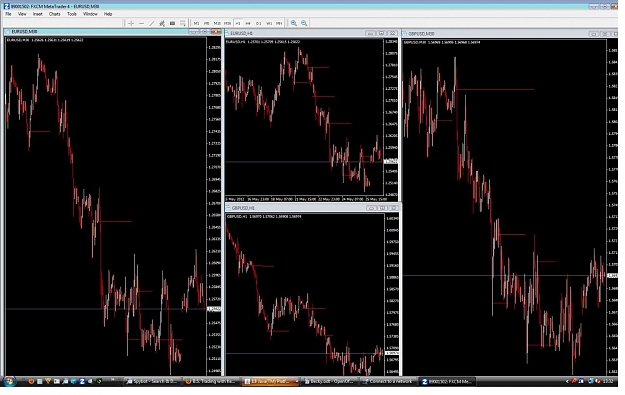
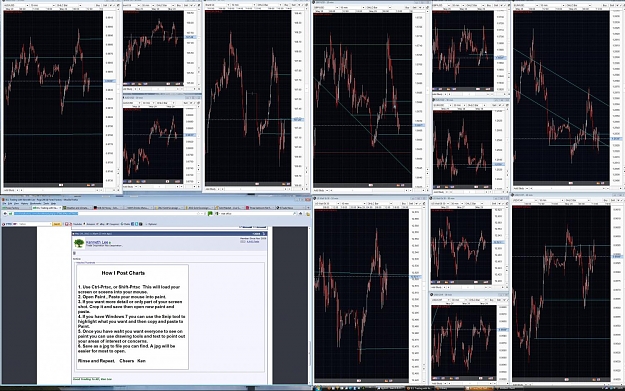
screen set up — did this on mt4-not really the same but hopefully shows you what I mean. Long charts are 30 min, smaller charts in middle are 1 hour. I actually have 10 min charts for intraday and 30 mins for longer term trend, I find this a ...
B.S. Trading with Kenneth Lee