- Search Energy EXCH
- 7 Results
-
 bit9ret replied Jan 11, 2012
Okay... — ...here you go: I'm interested in a very simple, but multi-timeframe, line study. Something that would look like the zigzag indicator, but NOT be based on repainting deviations from the last pivot, BUT painted at the close of that ...
Free Coder is here
- bit9ret replied Aug 25, 2010
Inside bars — I've gotta go, but here are inside bars marked. GU is noisy but this is quite clear here....Breakout/close out of the inside bars. Go with the expansion of volatility = the close out the range = inside bar. (It's just a ...
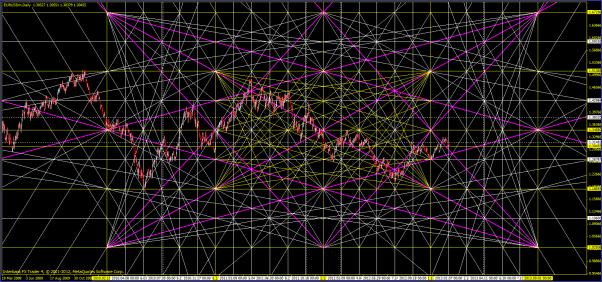
Time Cell Trading

- bit9ret replied Feb 21, 2009
Widening downward volatility bearish — Yes, would only be bullish if a NARROWING downward wedge. My take from rgitt05's daily GJ chart: bearish or a complex bottom (random expanding and contracting volatility, taking out lows and highs with ...
Auslanco - GBP/JPY and GBP/USD (newstrade)
- bit9ret replied Feb 21, 2009
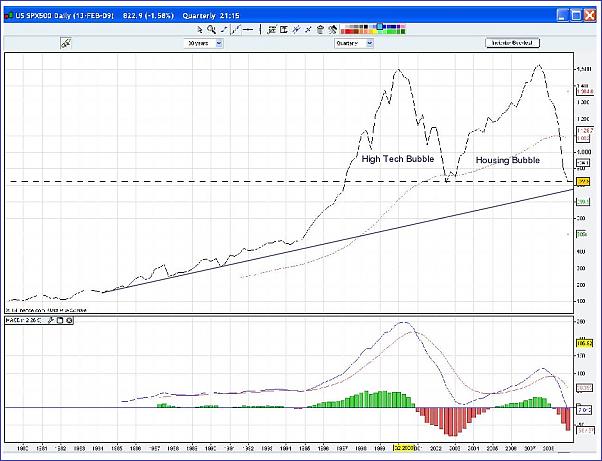
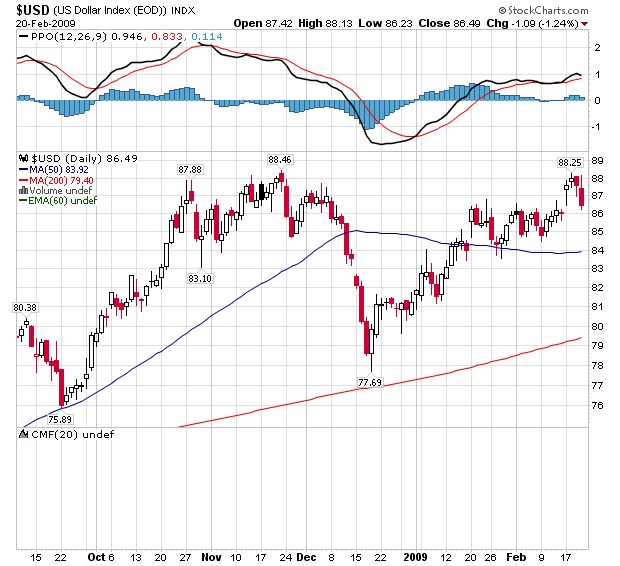
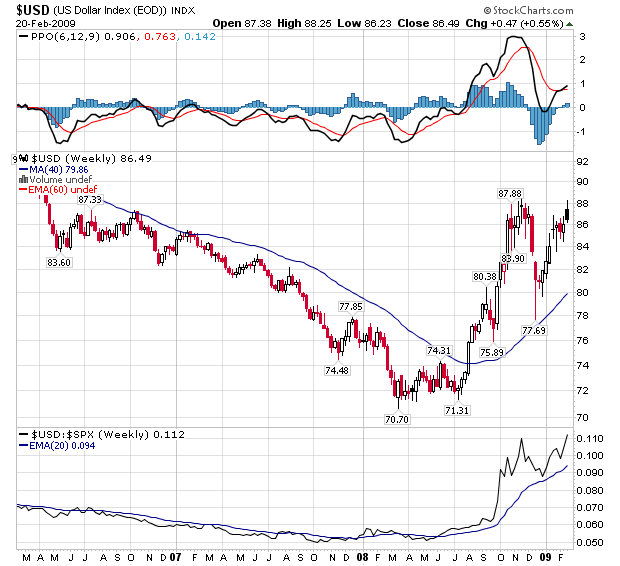
So gold up, USD (DX) down (weeklies across the board)... — And was thinking of kerfuffle caused by 30-year SPX chart: url Global macro funds "position" big dollars off changes in perception/outlooks, eg. Soros types. Fri's talk of ...
Auslanco - GBP/JPY and GBP/USD (newstrade)
- bit9ret replied Feb 21, 2009
See the dollar index (DX) overall... — Just a thought. And the big boys/funds move money around the USD/JPY as the driver.
Auslanco - GBP/JPY and GBP/USD (newstrade)
- Posts by Member Search: 'bit9ret'