- Search Energy EXCH
- 29 Results (1 Thread , 28 Replies )
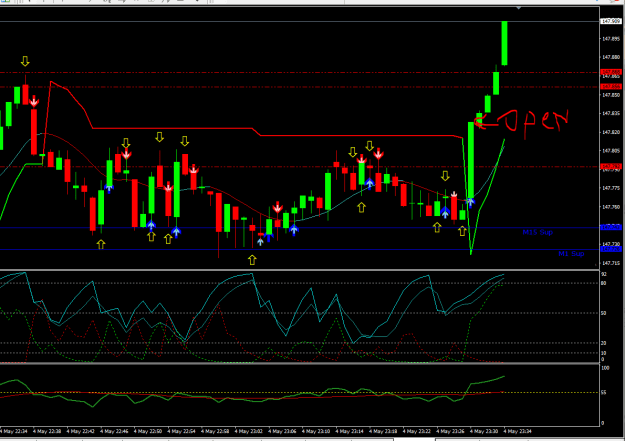
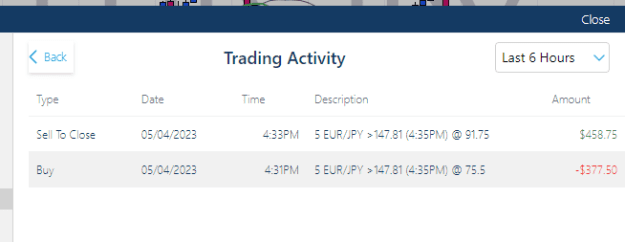
- My "5 Min Binary Option" journalStarted May 4, 2023|Trading Journals|3 replies

I trade "5 min binary option with good rate" system. I have made a few changes to my convenience. ...
-
 bcarbon replied Dec 1, 2022
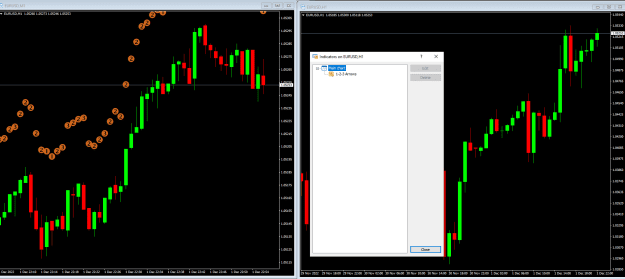
Thank you so much BestTradeEv!!! That is exactly what I need. However it only shows up in my 1Minute charts. Can you make show up in all time frames? Thank you!! image
I will code your EAs and Indicators for no charge
- bcarbon replied Dec 1, 2022
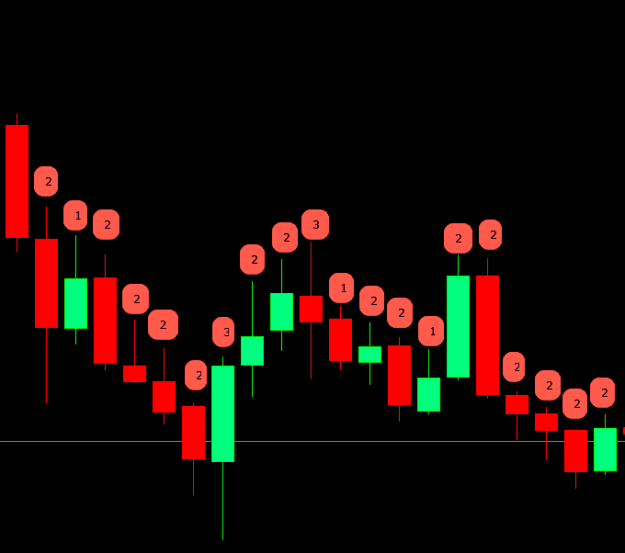
Help! I need an indicator that draws number 1, 2, or 3 on top of candle. Conditions: Using only high and low of each candle. Direction doesn't matter. Candle 1 = Inside candle. Draw a 1 if (High of candle < High of previous candle) & (Low of candle ...
I will code your EAs and Indicators for no charge
- bcarbon replied Aug 14, 2019
You are so wrong!!!! I never mentioned Asian session for once. Second, if an hour has, lets say the Asian session lasts only 4 hours (it lasts longer) and there are 12 five minute binaries per hour, that makes 48 in the Asian session per pair. I ...
5 minute binary option trading with good win ratio
- bcarbon replied Aug 29, 2012
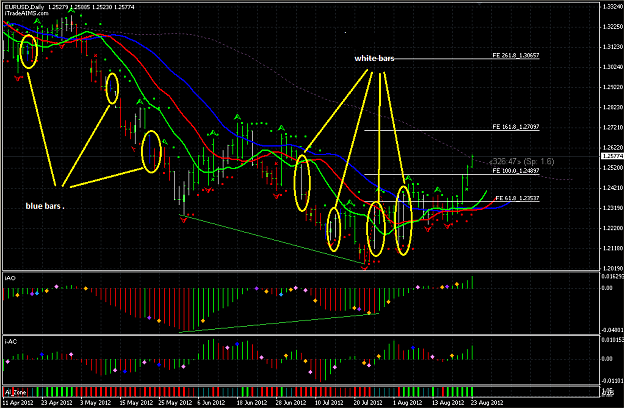
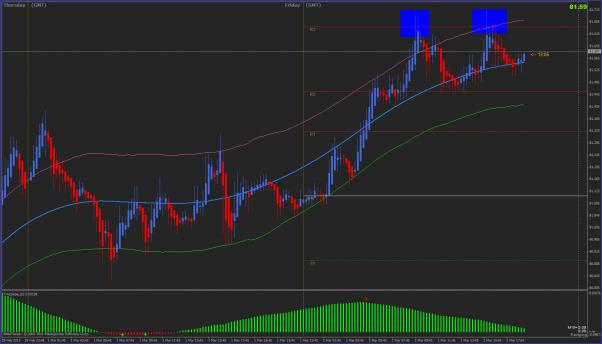
image Fed77, I have encircled the blue bars and white bars to explain better my question. Can you please explain to me the purpose of those blue bars and white bars? Thank you
Profitunity (Chaos) Trading System by Bill Williams
- bcarbon replied Mar 22, 2012
I use the MT4 Fibonacci Expansion Tool. The fractals I use in my chart tell me the three previous high-low-high points (or low-high-low) to draw the tool. The thick yellow lines are the levels drawn by the tool. It is almost like a crystal ball. ...
Extreme TMA System
- bcarbon replied Mar 11, 2012
Change it for this one. image Both are equally ugly and disgusting.
Extreme TMA System

- bcarbon replied Mar 11, 2012
They are called trolls. They look like this image or like this image Next time you see them around use the following to get rid of them image
Extreme TMA System


- bcarbon replied Mar 2, 2012
image This is Snails' pic. S3 is nicely above price. image This is my pic. S3 has been badly broken by price. Not good for a trade. Server was at 3 changed from 2. image This is my pic with original settings (server @ 2). Not good for a trade. ...
Extreme TMA System
- bcarbon replied Dec 7, 2011
image You can can do as good or better with a semaphore indicator. Semaphore is a fractal indicator that uses colors to tell you how shallow or how deep the move that follows "might" be. It is available in forexfactory for free. As you can see in ...
I will code your EAs and Indicators for no charge


- bcarbon replied Dec 15, 2010
Hi LawGirl, You have a wonderful thread going on here. I am quoting your attachment because we have the same indicator (RSI arrows and regular RSI) however I just compared and mine are not in agreement as yours. Mine image Yours image I checked ...
Trade What You See - Almost Naked Trading

- bcarbon replied Aug 19, 2010
Have been lurking this thread for sometime. Nice, uncluttered system. Here is my two-cent contribution. Attached is the M30 chart showing divergence in three different instances. In all three, they predicted the following big move before it started. ...
GU Intraday System
- bcarbon replied Aug 17, 2010
I found a very nice CCI divergence indicator. It draws the lines on both CCI and PA, red for bearish divergence and green for bullish. It even gives an alarm when a divergence is detected not only a sound alarm but also a pop-up alarm. image The ...
Time Cell Trading
- bcarbon replied Aug 16, 2010
To be honest, since late last week I have spent most of my time searching for the right indicator rather than trading. There are thousands of indicators to try and very little time, so I cannot tell you how they work in different time frames because ...
Time Cell Trading
- bcarbon replied Aug 16, 2010
image This trades are from last night. Pretty good,
1min scalping using mtf ALF by bbolss Every time it opens a trade, it opens two positions. I might start writing a manual soon for personal reference. It would make things easier than starting from zero every time.
- bcarbon replied Aug 11, 2010
image Here is how I look at it. CCI and PA are showing a big divergence. That alone is a big signal, even if CCI is not quite yet at -100. PA is almost touching Extremely- overshot level. The two candles in question formed a double bottom and the ...
Time Cell Trading