- Search Energy EXCH
- 46 Results (1 Thread , 45 Replies )
- andys0506 replied Apr 29, 2020
Laura, is the slope of the 200 important. Would you have taken this long as the channel crossed? I notice that both the 15m and 1hr were below the SMA so if we do a MTF analysis perhaps a long was risky.
Roadmap - A Way To Read Markets
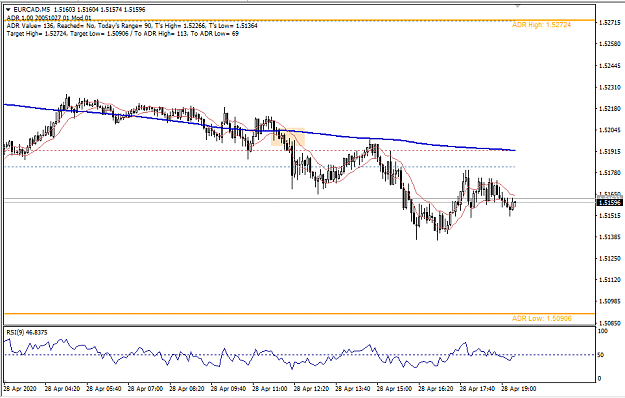
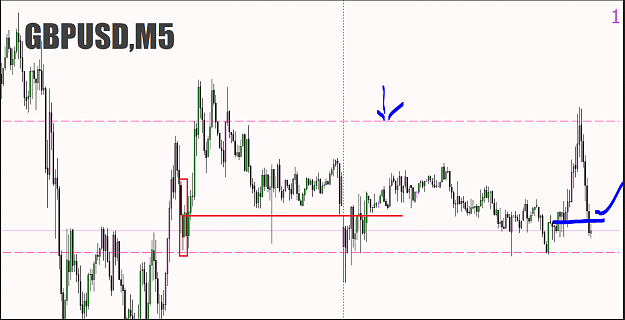
- andys0506 replied Apr 28, 2020
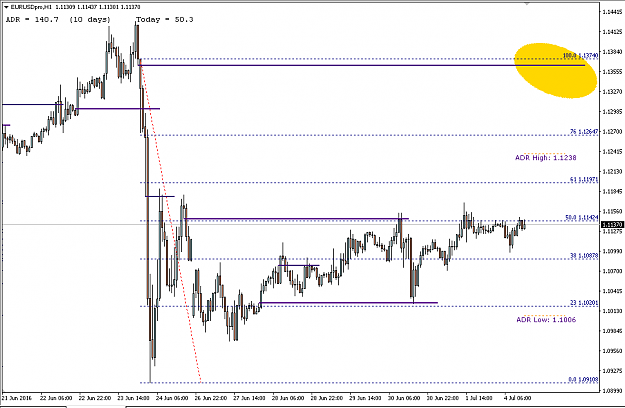
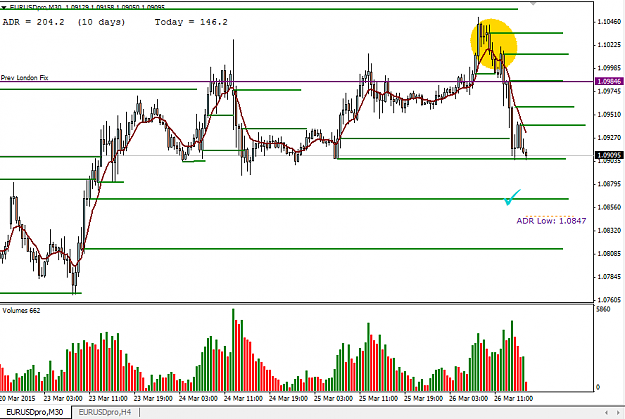
Cool, so take this for example. Nice opportunity in the peach box. Target would be lower ADR. Where would you put the emergency stop?
Roadmap - A Way To Read Markets
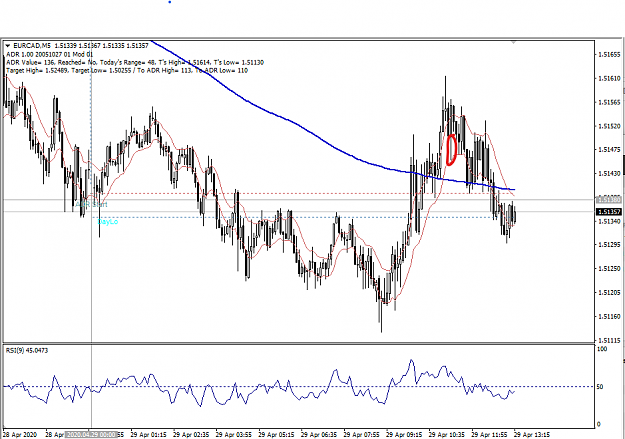
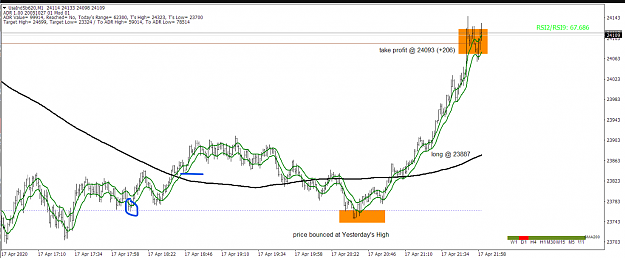
- andys0506 replied Apr 20, 2020
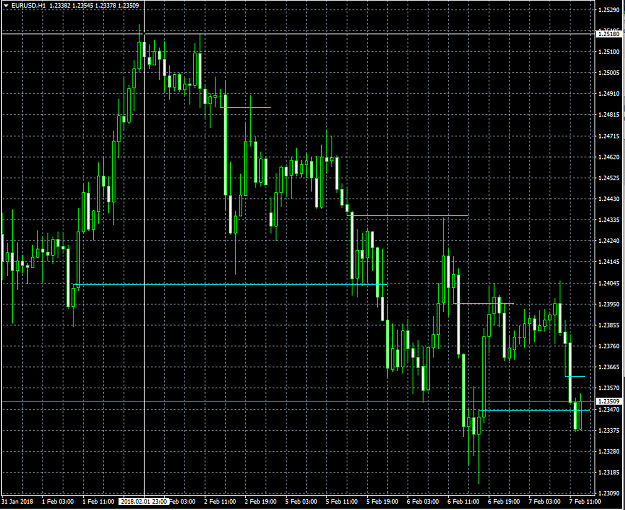
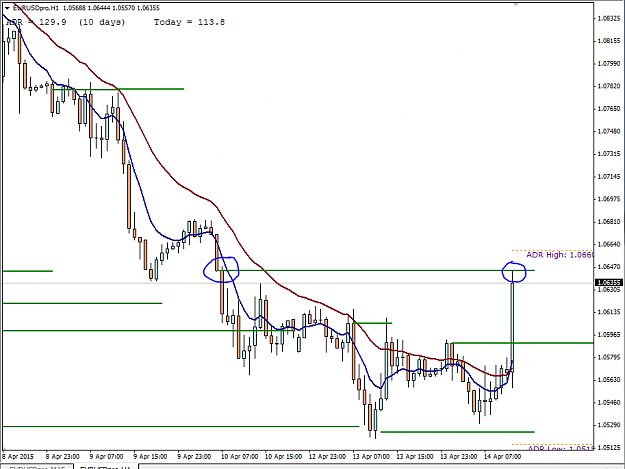
Hi Laura, your thread looks interesting and I am just starting to go through it. I have a question on one of your first charts. Why did you not treat the circled area as the bounce off of yesterdays high, and then enter at the blue line. Why did you ...
Roadmap - A Way To Read Markets
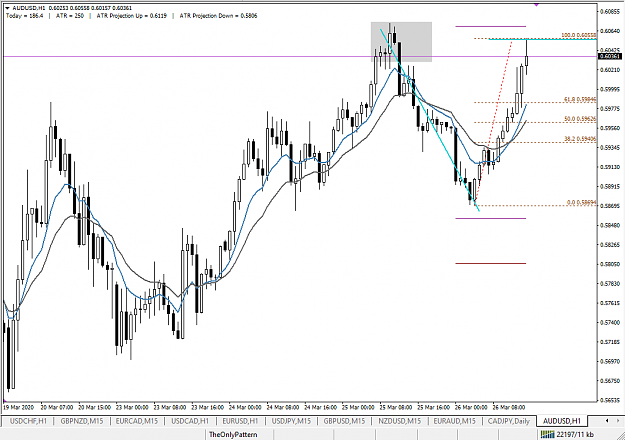
- andys0506 replied Mar 26, 2020
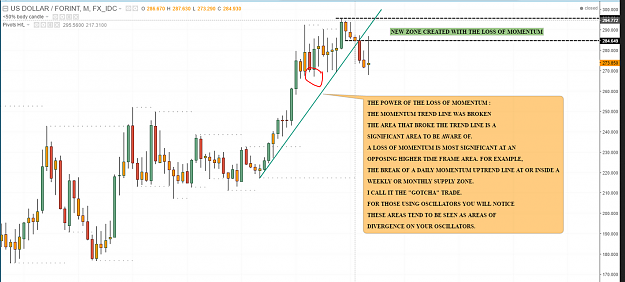
The grey box is an area of concern. A big impulse move came from that area previously.
3 Bar Fractal Break
- andys0506 replied Mar 1, 2019
Hi, I have a question on one of your 'posts of interest' on post 1. Can you explain why the formation I have shown in red was not a good entry?
High Level Accuracy Method With Little To NO Draw-down
- andys0506 replied Feb 7, 2018
The old hourly hidden gaps keep on giving. Next visit 1.2362 ish I suspect soon.
Leftovers at the dinner table, re-testing opening levels
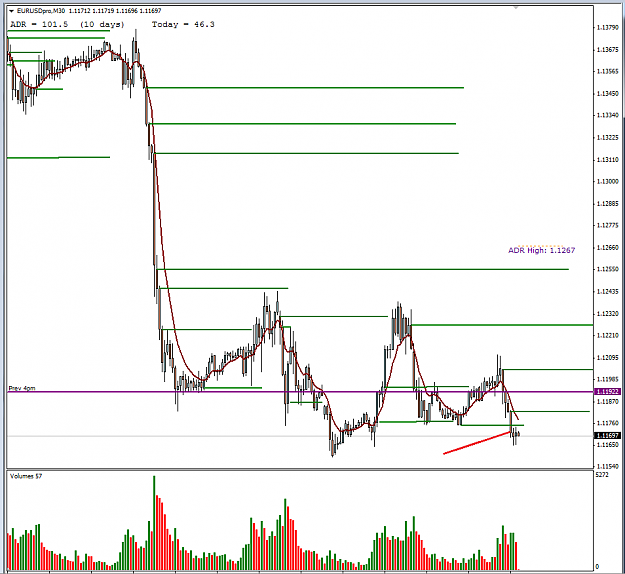
- andys0506 replied Jul 4, 2016
Possible next target, for whatever reason, price needs to come back to these areas. I don't yet know why, but I sure wanna work it out! If we get a close above the 50% fib I'd be tempted to long with target at the 1.1360 area.
Leftovers at the dinner table, re-testing opening levels
- andys0506 replied Jun 3, 2016
Hi, question on momentum lines. This chart is from page 2 of the thread. Can you clarify how you draw these lines. See the red circle, to me that is a pivot low and would make the line much steeper.
Trading Institutional Order Flow
- andys0506 replied Jan 14, 2016
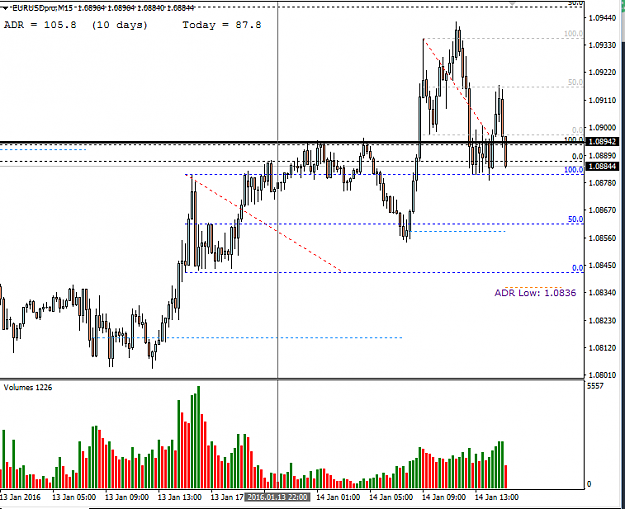
Thanks Prez, good clear explanation! Do you have a criteria for when a zone can be removed, for instance the grey fibs mark todays highest 1hr volume (9am GMT). The fact that the range high and low have been breached does that mean it is a dead zone ...
Prez Forex (pres78) Trading Journal
- andys0506 replied May 29, 2015
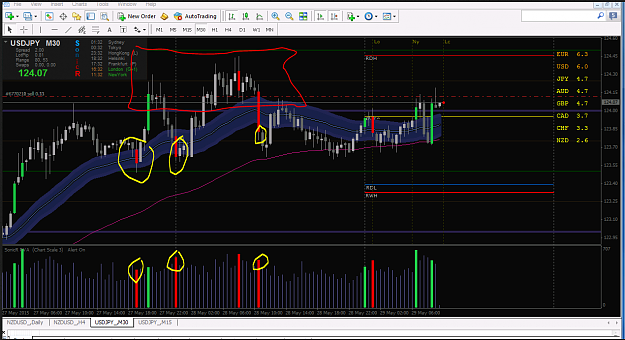
I'm seeing pullbacks and buying below the whole number indicating bullish behaviour, see my yellow circles. TAH what do you think?
PVSRA (Price, Volume, S&R Analysis)
- andys0506 replied Apr 14, 2015
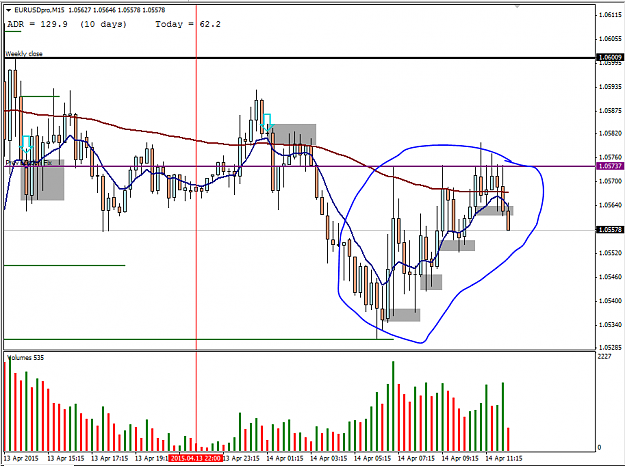
Nice compression/consumption or whatever you choose to call it. Setting up nicely. Won't be surprised to see a fake out upwards on release before the down move
EURUSD
- andys0506 replied Mar 26, 2015
So far so good, eyeing up 870 now before we then re-assess direction.
Leftovers at the dinner table, re-testing opening levels
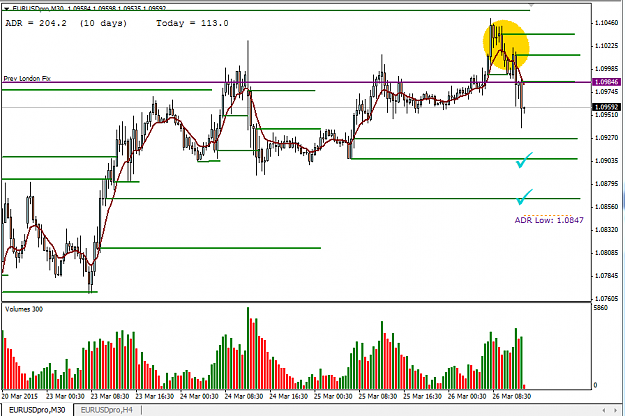
- andys0506 replied Mar 26, 2015
Immediate trend appears to be down as we have untested down bars (circled) I think for now we can target the untested lines marked with a blue tick.
Leftovers at the dinner table, re-testing opening levels
- andys0506 replied Mar 14, 2015
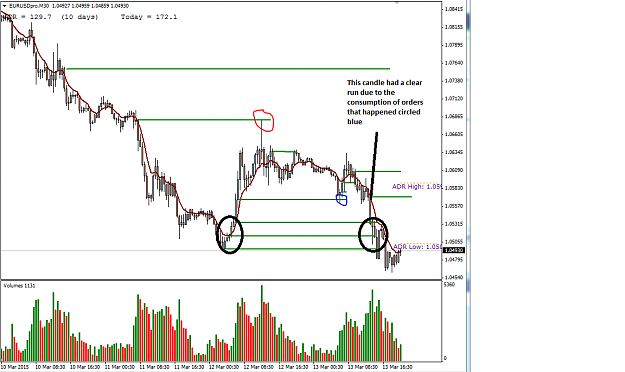
Thanks Stu, look forward to seeing what you got. One thing I'm struggling with is identifying the difference between consuming orders which clear the way for a future push through after a reversal, or when a revisit occurs as a sign of strength and ...
Leftovers at the dinner table, re-testing opening levels
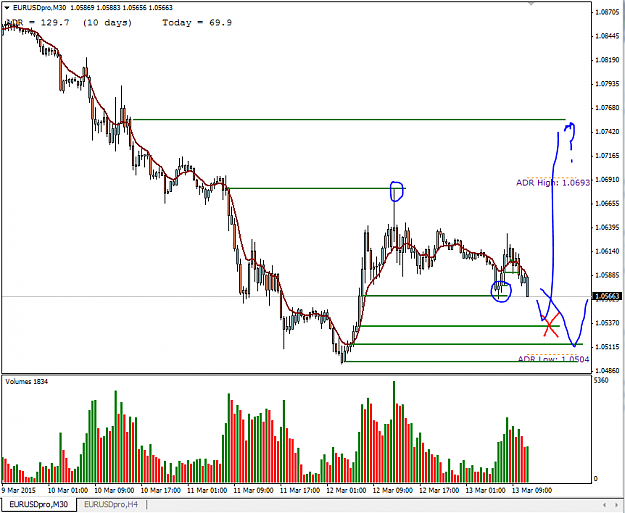
- andys0506 replied Mar 13, 2015
Normality appears to be returning, for the time being anyway. Blue circles show the recent opens that have now been retested and orders absorbed, which may mean we are now clear to break beyond those levels to the next one. Red x marks my immediate ...
Leftovers at the dinner table, re-testing opening levels
- andys0506 replied Mar 12, 2015
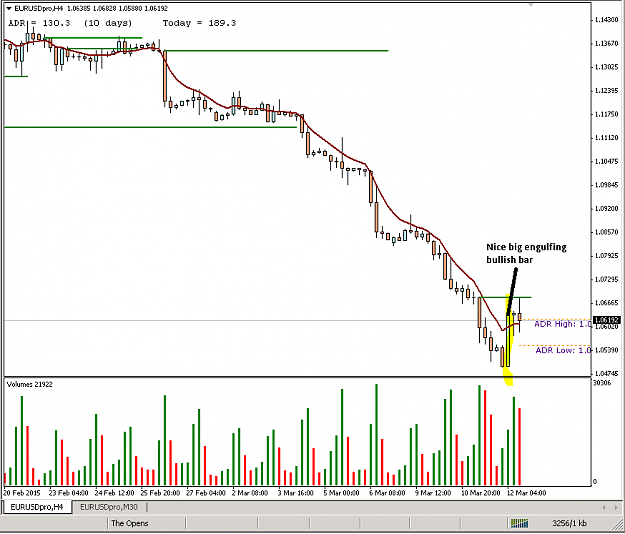
Think this sell-off may well be coming to an end. Nice engulfing candle, plus some good rejections from the subsequent two candles.
Leftovers at the dinner table, re-testing opening levels
- andys0506 replied Mar 3, 2015
Lots of untested down bars suggest the down trend is strong. The candle marked with the red line broke strongly and closed below an untested previous open. Small pullback as seen, we can expect price to go down from here. I see no reason to play any ...
Leftovers at the dinner table, re-testing opening levels