- Search Energy EXCH
- 8 Results
- andy9775 replied Jul 28, 2011
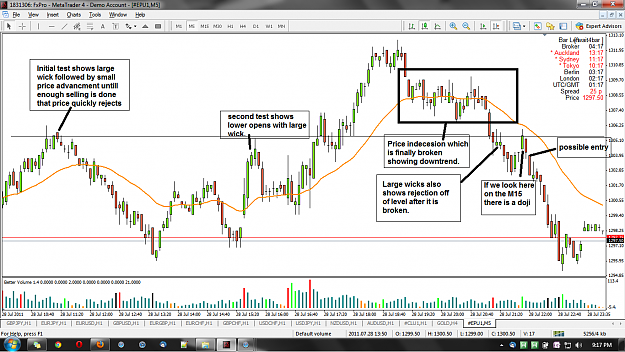
The initial test of the level and rather quick retreat shows lots of supply there. Then the level finally gets broken and we start to see exhaustion. First the highest high on your chart 1312ish from what I can tell shows consolidation/indecision ...
Romancing the Price
- andy9775 replied Jul 14, 2011
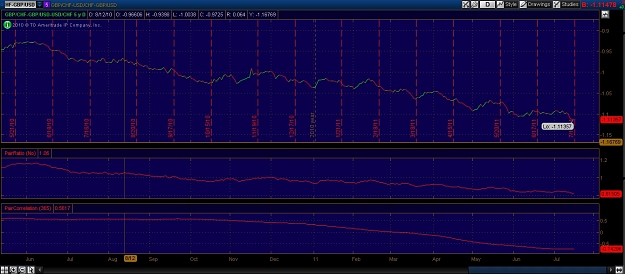
Your not really hedging anything. If taking a 1:1:1 position all your doing is trading the pair spread. Take a look at the picture, shorting gbp/chf and going long usd/chf and gbp/usd at any time in the past would net you positive results, but if ...
Three Pairs Hedging
- andy9775 replied May 25, 2011
Short gbpusd SL at 63032. thoughts? Sorry if the charts a bit messy. edit: stopped out edit2 realized what I did wrong rather quickly. Newb mistake. Gotta get used to PA and s/r.
Price is everything
- andy9775 replied May 23, 2011
Ive been following this thread for the last few days and Im enjoying it. Ive recently switched to pure PA/support and resistance/trend lines. Anyway I want to make sure Im getting this right. Was a little late for this trade and hoping it would pull ...
Price is everything
- andy9775 replied Dec 4, 2009
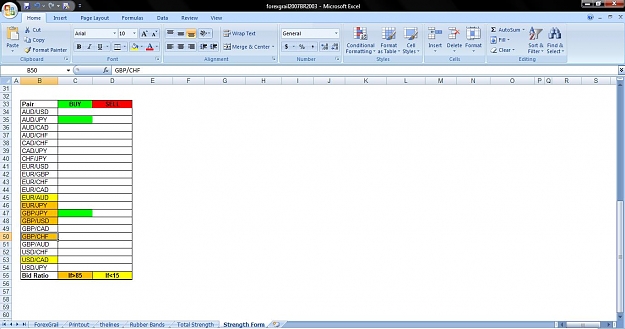
I updated again, this time bid ratio is added.
Forexgrail excel indicator
- andy9775 replied Dec 4, 2009
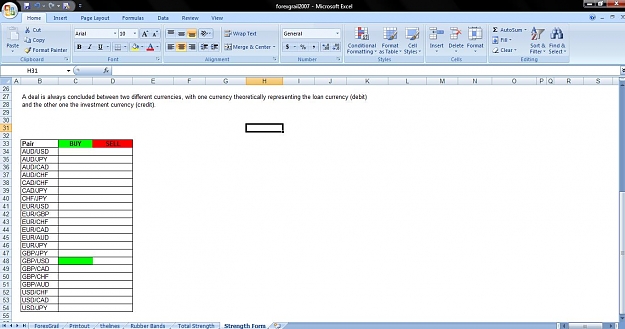
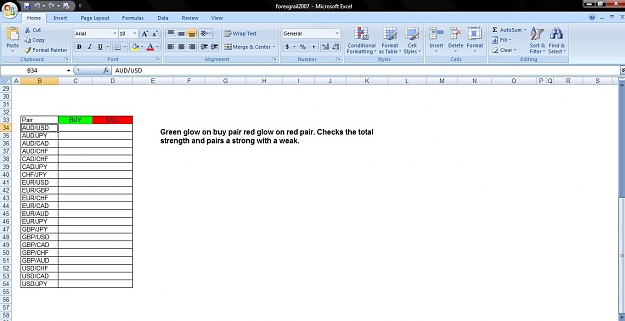
gbp was strong and usd was weak. Helps you I.D the pairs instead of going through the process in your head, one is weak one is strong now do I buy or sell????
Forexgrail excel indicator
 Makes the process faster.
- andy9775 replied Dec 4, 2009
I have made some changes to the file -Added a buy/sell section in the strength form -changed strong weak colors, strong is now green weak is red. The zip contains two files the forexgrail2007 is a excel 2007 workbook, it may or may not open with ...
Forexgrail excel indicator
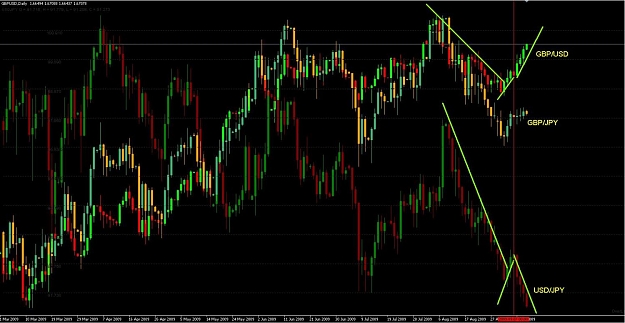
- andy9775 replied Sep 11, 2009
Don't post much on here, and I learned a lot so I thought Id contribute something. This just shows a visual as to why GBP/JPY has no direction and is choppy, specifically m5 m15 and m30. Just shows the first trend line both gbpusd and usdjpy move ...
Auslanco - GBP/JPY and GBP/USD (newstrade)
- Posts by Member Search: 'andy9775'