- Search Energy EXCH
- 18 Results
-
 andddres1 replied May 15, 2017
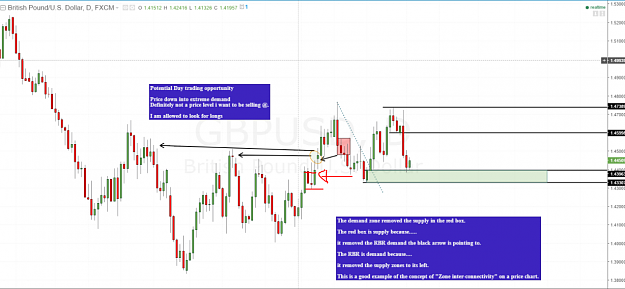
Hi AKT, I have this question and reading the thread i found a perfect chart for my Q in this chart image see my red anotation isnt a reaction to the previous DZ, so it would make it non-authentic please, i dont understand if the one you marked is ...
Trading Institutional Order Flow
- andddres1 replied May 15, 2017
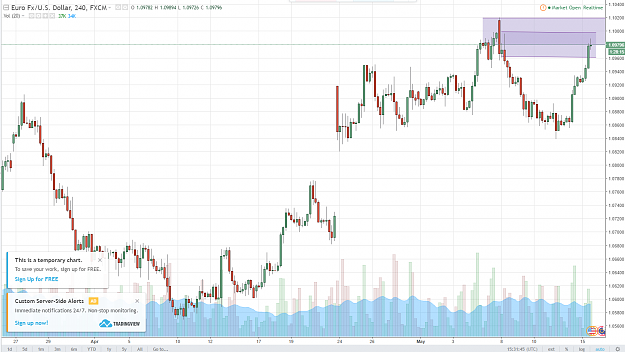
EU 4HR SZ into Daily SZ image I think it could be a SAF trade regards, Andres edit: i see there is no 3:1 RR re-edit: only HTF SZone can take a LTF Dzone, so it would work?
Trading Institutional Order Flow
- andddres1 replied May 11, 2017
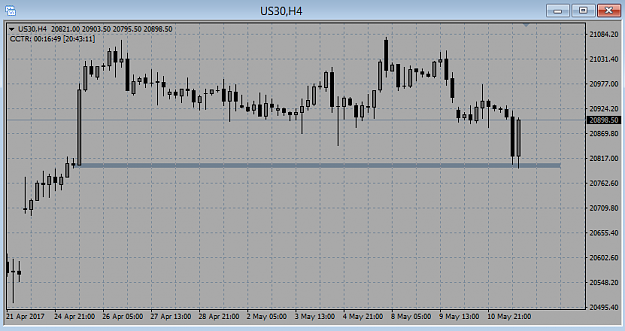
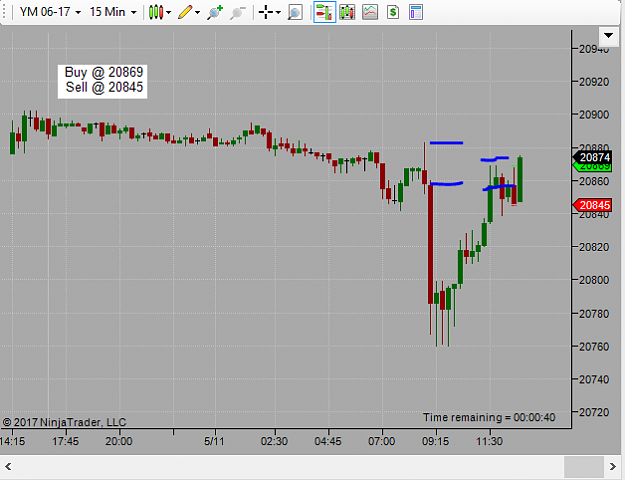
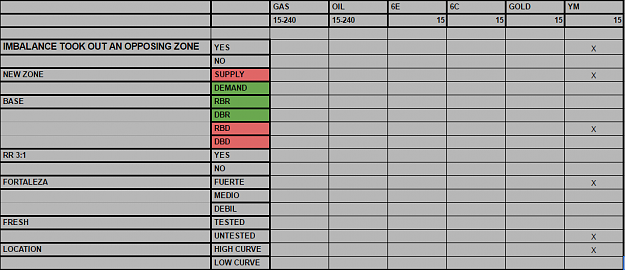
Good afternoon, please anyone check this and tell me if its right or what do I need to get better at. I got out at BE becouse of dolldrums, luckly regards, Andres 4hr image 15min image Decision matrix image
Trading Institutional Order Flow
- andddres1 replied May 5, 2017
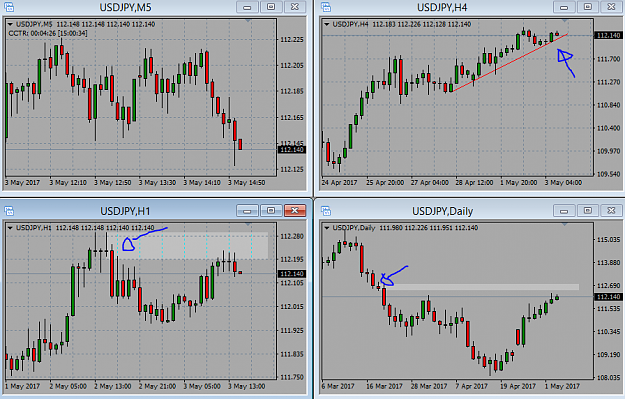
Good morning all, UJ on Daily SZ + 4HR trendlinebroken image regards, Andres
Trading Institutional Order Flow

- andddres1 replied May 3, 2017
Good morning everyone, here is my charts for UJ, please correct me if im wrong image regards
Trading Institutional Order Flow
- andddres1 replied May 2, 2017
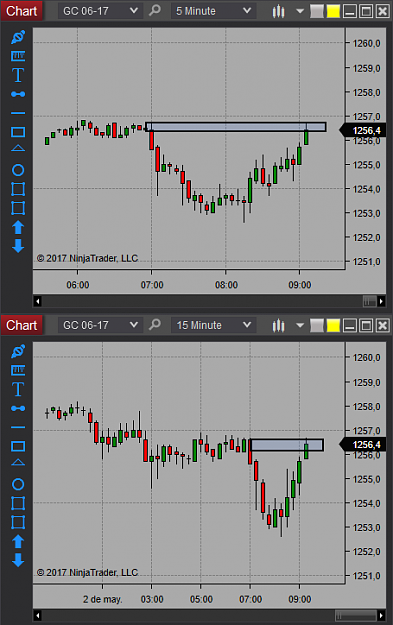
Good morning traders, would this apply as a SZ? regards, image
Trading Institutional Order Flow
- andddres1 replied Feb 1, 2017
Guys please help me, is this analysis good? Natural Gas possible long, not trading it for the news Andres image
Ratios & Harmonics: a Different Way to Trade

- andddres1 replied Jan 26, 2017
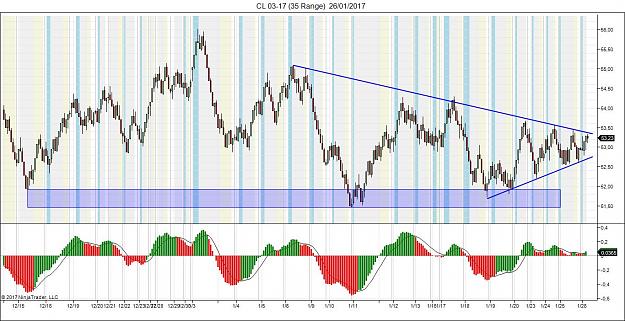
Hello Damian, Thank you very much for sharing this knowledge, Im new to it, here I post a CL chart, please all correct me if Im wrong, should I look only for longs? image Andres
Ratios & Harmonics: a Different Way to Trade
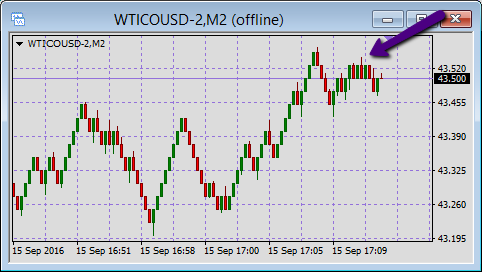
- andddres1 replied Sep 15, 2016
Look at this non refreshed chart image Now after I click on properties and then ok, look how the chart changes, its only a few minutes, imagine how would it be for hours image Thank you sir,
Non-gap Renko Chart Creator EA

- andddres1 replied Jul 28, 2016
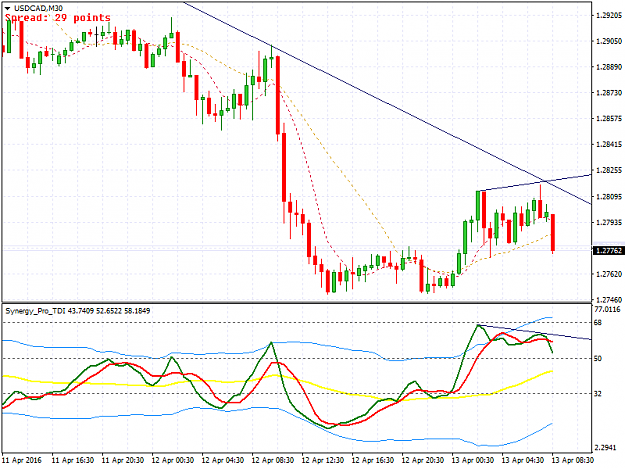
So, here is another trade on UC image My TS is near BE now
Price Action (Renko)
- andddres1 replied Jul 28, 2016
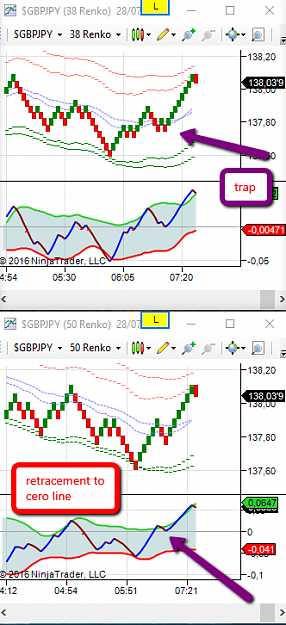
Guten morgen traders here's GBPJPY, I have been looking its behavior for a couple of days and its giving patterns, dont like its strong correlation to UJ and GU but it can work image regards,
Price Action (Renko)
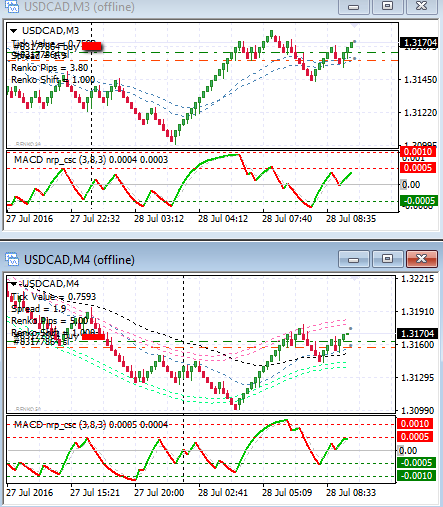
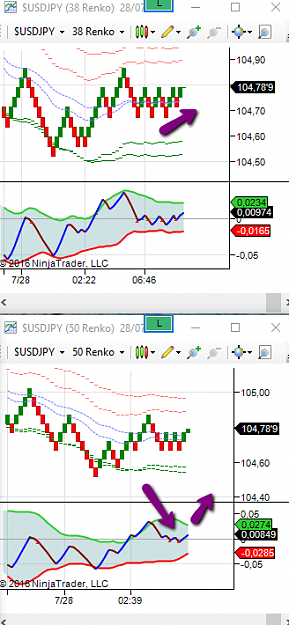
- andddres1 replied Jul 27, 2016
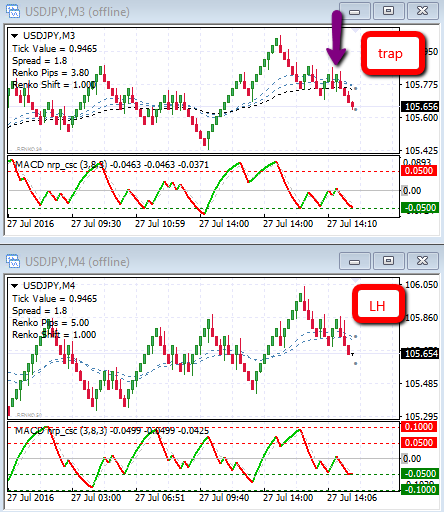
Again USDJPY image Lower high on M4 (renko 5.0) The confirmation was a fail counter trend pattern on the M3 (renko 3.8) so I assumed a continuation pattern
Price Action (Renko) Andres
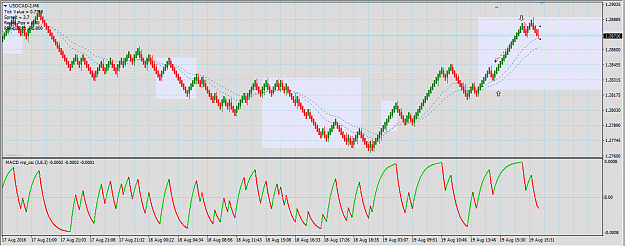
- andddres1 replied Jul 27, 2016
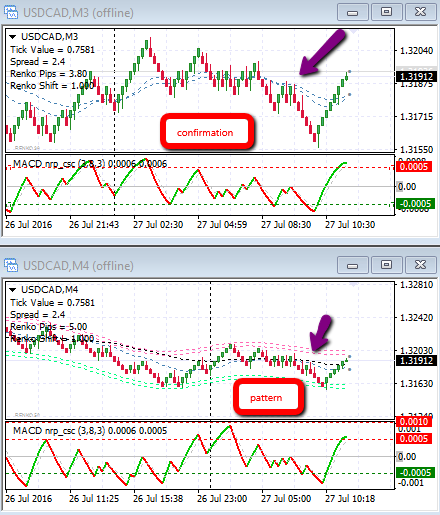
Here is a trade I took this morning on USDCAD image What I saw was a Lower high on M4 (renko 5.0) The confirmation was a fail counter trend pattern on the M3 (renko 3.8) so I assumed a continuation pattern Target was previous pivot zone
Price Action (Renko) ...
- andddres1 replied Feb 9, 2013
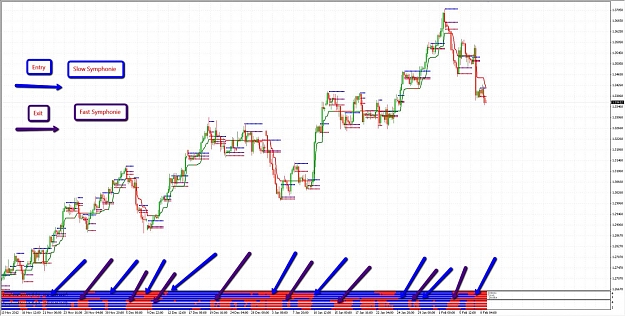
Hey Stickbow21, looking at your charts, this idea came up image so here is.. 1-Entry: slow and fast Symphonie aligned 2-Exit: fast Symphonie shows opposite signal backtesting just visual cheers
Symphonie Trader System
- andddres1 replied Feb 6, 2013
Hello Evaluator, I attached a pic with an indicator called "arrow" I was wondering what this represents, is it an EMA cross or something? bye for now
Symphonie Trader System

- Posts by Member Search: 'andddres1'