- Search Energy EXCH
- 19 Results
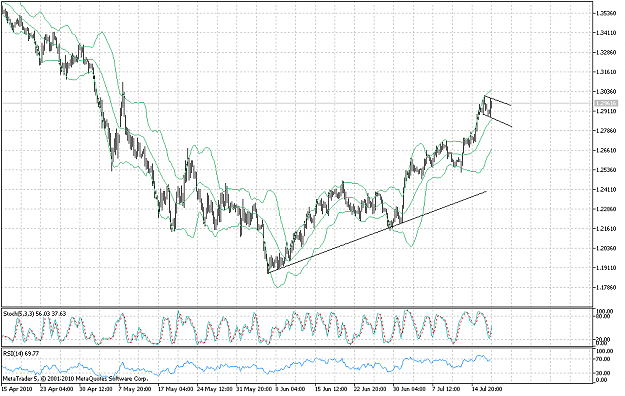
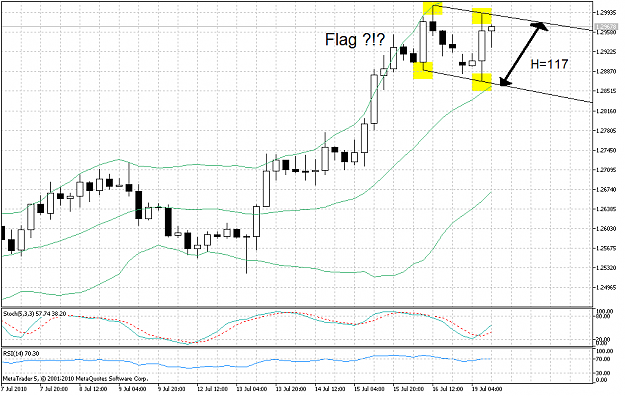
- alxxx replied Jul 19, 2010
Flag formation ?!? — 4 hour time frame show some kind of figure, but is not corectly formed. What do you think this is a flag formation ?!
EURUSD
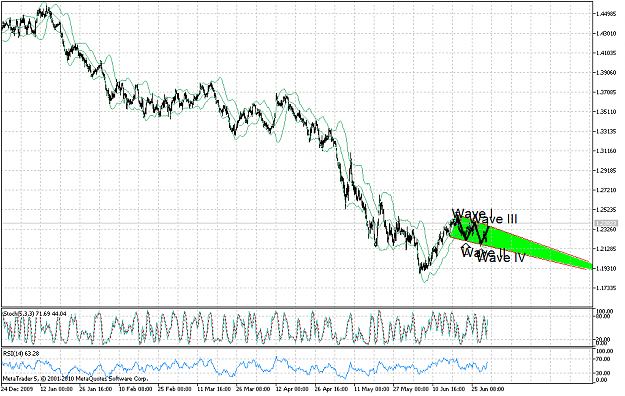
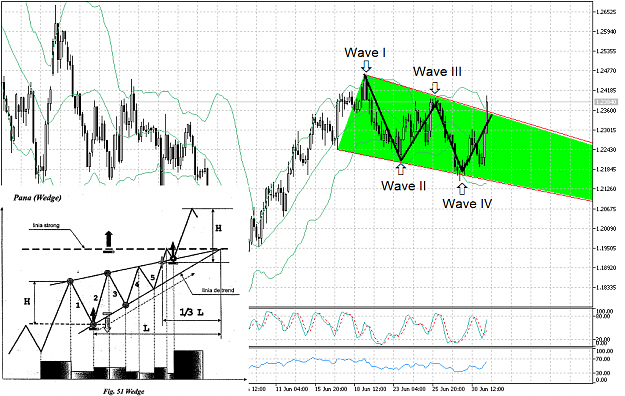
- alxxx replied Jul 1, 2010
4 hour wedge ?!? — I`m waiting some ideas if we take in consideration this wedge or not ?!?
EURUSD
- alxxx replied May 24, 2010
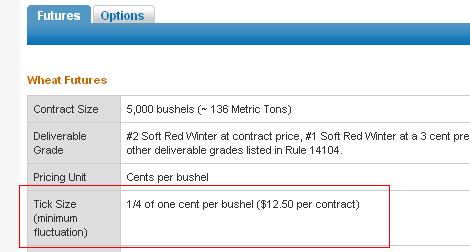
Commodities question — Hy everyone, can anyone tell me if the price of wheat on contract at Chicago Mercantile Exchange is 470'2 $ or evrey pip is 12,5$ wich that mean one contract is (470*12.5$) 5875$ ?!? here is the link where you can find ...
EURUSD
- alxxx replied Dec 18, 2009
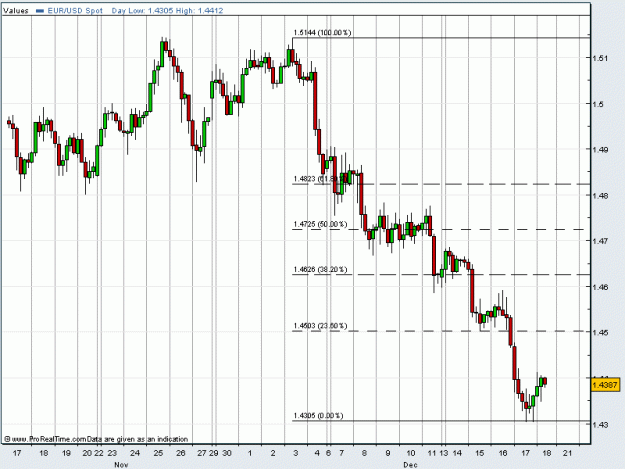
eur/usd at 1.44xx today — Because of the last 3 days rally on this pair, price will have a corection. First target is 1.4503(23,6%Fib retracement), but I don`t think will be shooted today, the buyers will push it until 1.44xx, but you can move ...
EURUSD
- alxxx replied Dec 16, 2009
Company that has best — Company that has best marketing ideas to promovate this market. You find the holidays spot from this company here "Post for reduce the stress before FED rate decision."
EURUSD

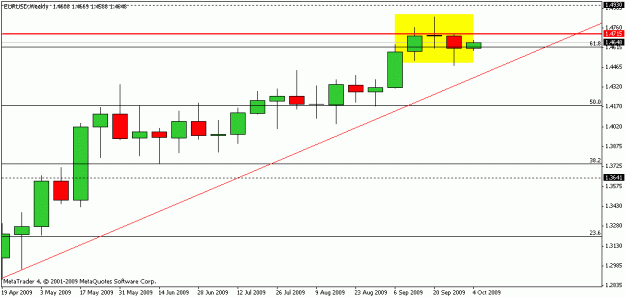
- alxxx replied Oct 5, 2009
Today High is a trap?!? — I can`t ignore weekly chart and doji candlestick in a Bearish formation an Weekly Evening star. image The next candlesticks on H4 formation is very important in the long term run, beacuse MACD already decide to be ...
EURUSD
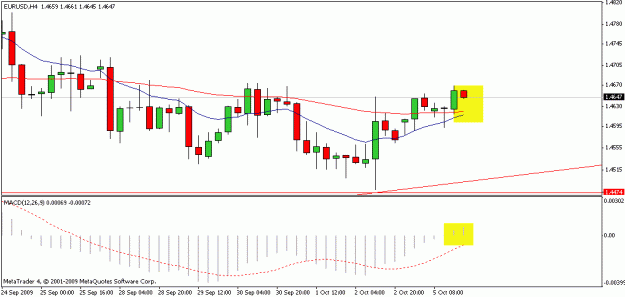
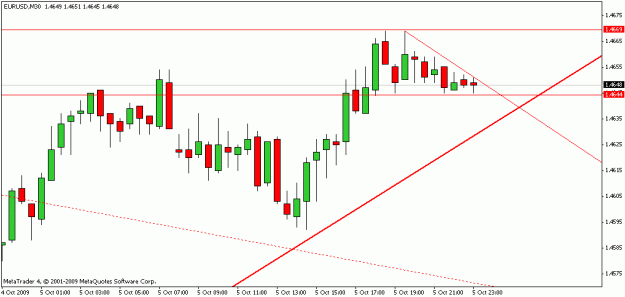
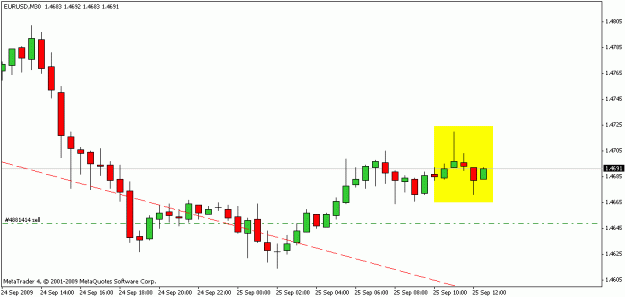
- alxxx replied Sep 25, 2009
The best moment you can sell — On the long run 12:30PM(London time) was the best moment you can sell on Eur/Usd pair at the conversion of 1.4683, on H4 Moving Avarage 13 and 55 are meeting verry soon image On m30 pair create a Shooting star ...
EURUSD
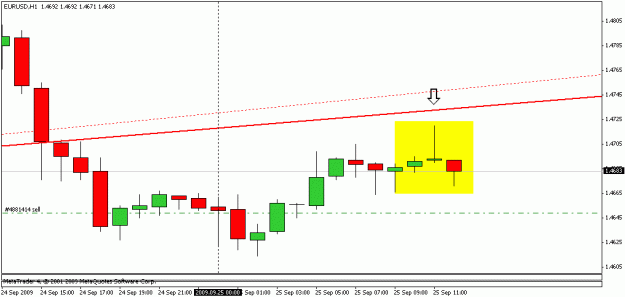
- alxxx replied Sep 10, 2009
sell move again — one candlestick in the opposite direction of trend that eat 2 or more candlesticks in the direction of the trend is a sign of the bullish reversal
EURUSD
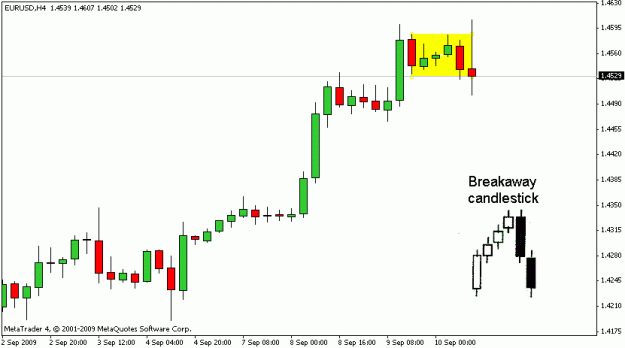
- alxxx replied Sep 9, 2009
looks like a sell moment — this it will be an Evening star formation .
EURUSD
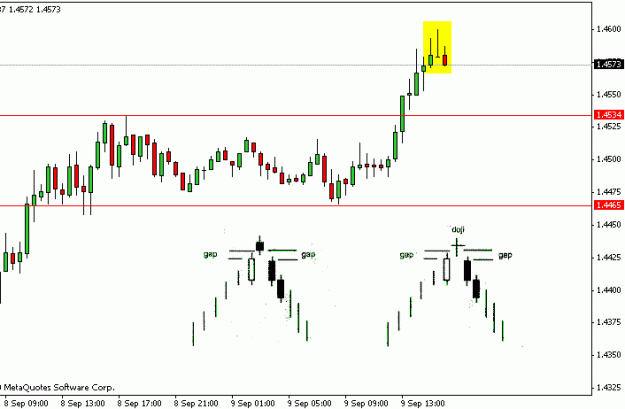
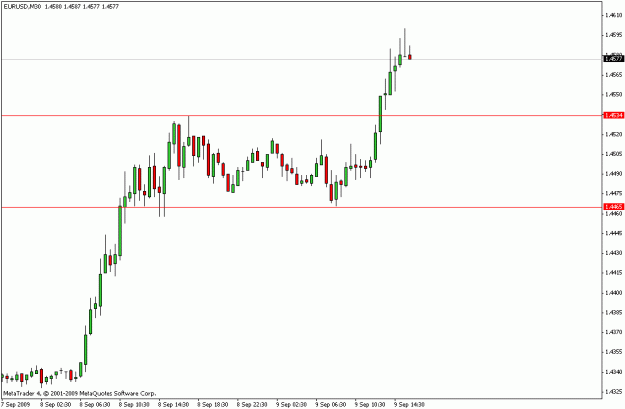
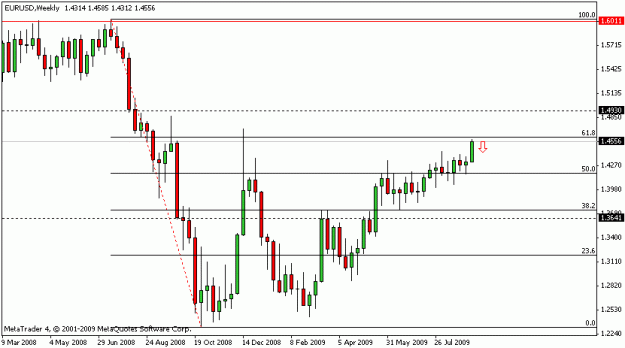
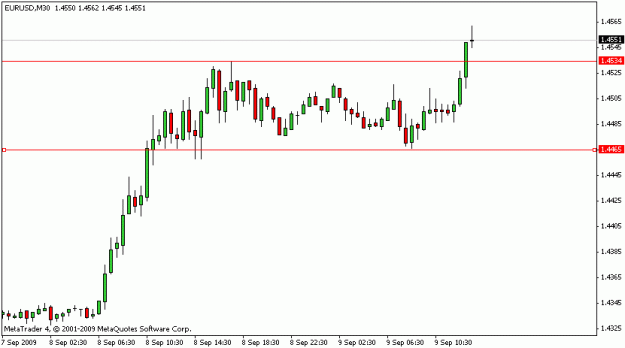
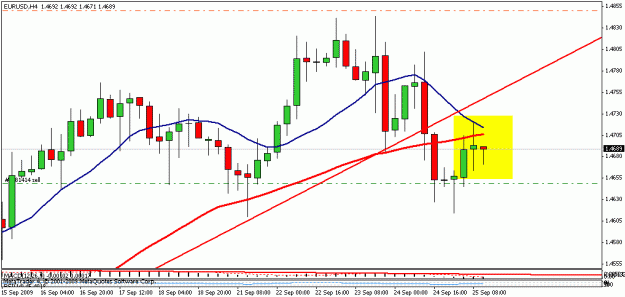
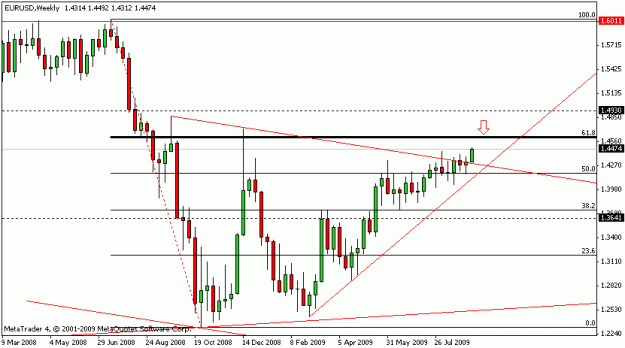
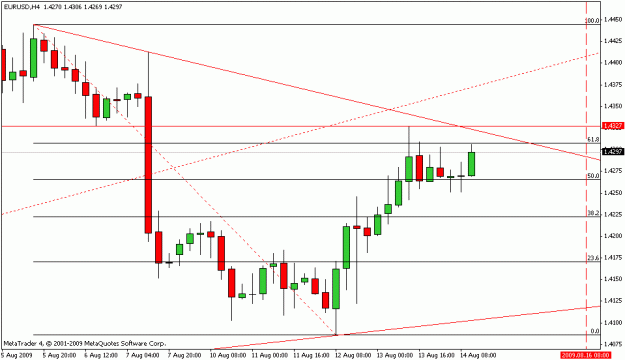
- alxxx replied Sep 8, 2009
I earn some money on this bulls move , but sad in the same time because triangle formation is history. My next target is 61,8 Fib on Weekly chart.
EURUSD
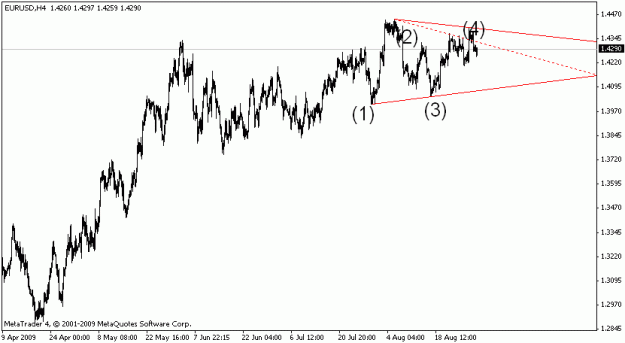
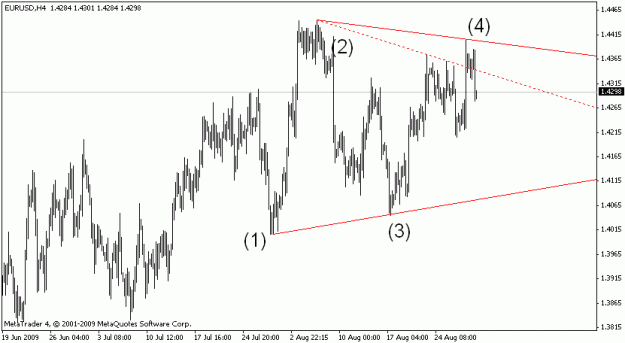
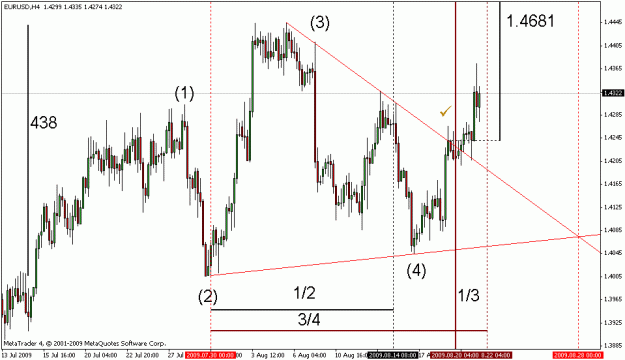
- alxxx replied Aug 23, 2009
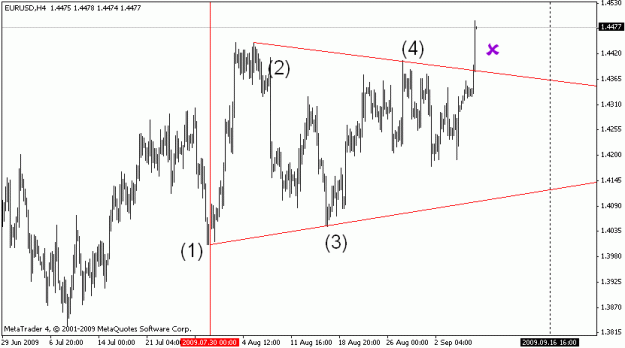
Symmetrical Up Triangle ?! — H4 timeframe have some highs and lows that seems to be a symmetrical triangle; this formation have: - the breakout it was on 1/3 area from the peak. - the breakout it was on 1/2 and 3/4 targets from the base of ...
EURUSD
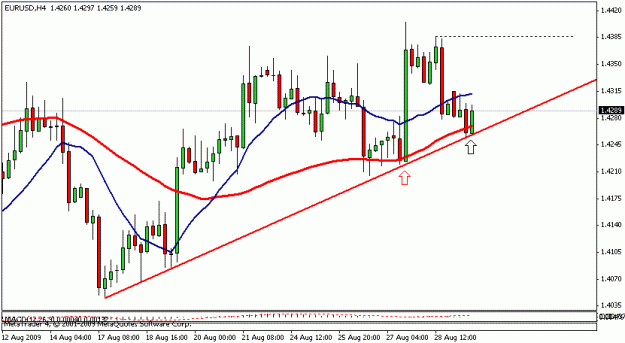
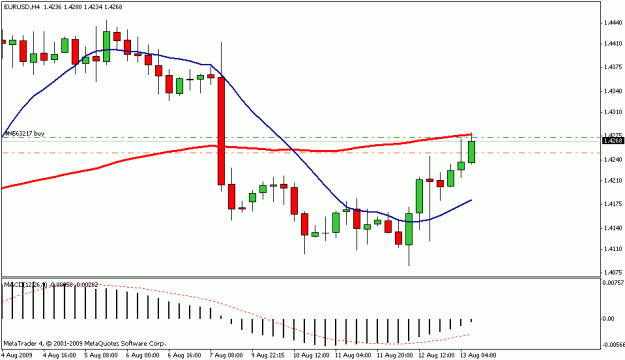
- alxxx replied Aug 13, 2009
I think untill the London tradersbreak we wont pass by 55 Moving Average on h4, after break the market will move preferably up.
EURUSD
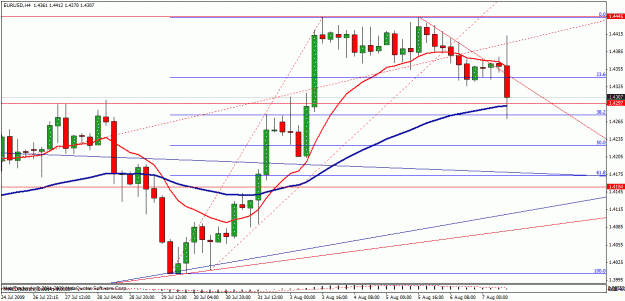
- alxxx replied Aug 7, 2009
here is how I see things, if this 4H bear candle close under the 23,6Fib level, we will see bearish trend until 38,2 or 61,8
EURUSD
- Posts by Member Search: 'alxxx'