- Search Energy EXCH
- 8 Results
-
 alcastro replied Nov 22, 2007
Here is how I played the cable: entered after the V formation., right after the 2nd candle was broken to the upside. Got stopped the first time but in again using Jacko's anti-hedge system. So far I am in profit. I am not planninmg to move my SL ...
The System (Irony included)
- alcastro replied Nov 19, 2007
My hands are hurting....so long have I been sitting on them. This market continues to range...and FEB's excellent exercise validates the wait and hold position. But I was looking at the US/JP. If I was trading it mechanically, I should have jumped ...
The System (Irony included)
- alcastro replied Nov 14, 2007
Leigh, here is the chart with the gap.The previous bar closed at 1.4602 and the next one opened at 1.4645.
The System (Irony included)
- alcastro replied Nov 10, 2007
Here a pair of charts. One is the AU/US and it was atrade I made last week focusing on Feb's method: The orange broken line shows where i entered the trade. I had a Stop Buy order just at the low of the previous candle (the one just after the ...
The System (Irony included)
- alcastro replied Nov 2, 2007
What is wrong with my charts? — Hi, I was looking at the charts that FREED posted for GB/CH and AU/US and noticed that mine differed from them. Specially significant with AU/US, which in my case, did not generate the "go long" signal. My ...
Trend Smasher - Profitable Mechanical Long Term Position Trading
- alcastro replied Sep 24, 2007
Hi Effi, here is my daily E/J chart. I don't see the reentry. Maybe my chart settings are wrong?
EMA 25-50 Trading System (Detailed)

- alcastro replied Mar 11, 2007
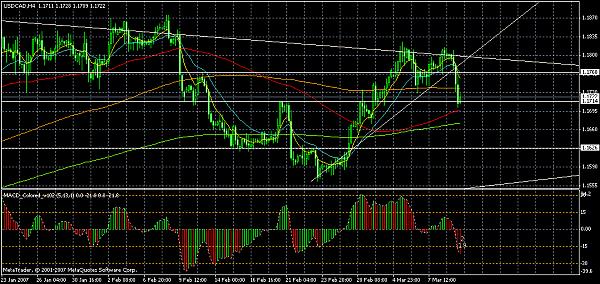
IRUSOH, this is what I am talking about — Hi Irusoh, This is what I am talking about regarding the MACD indicator. As you can see in this US/CAD chart, there are two sets of numbers. What does each one represents?
4 Hour Strategy (MACD)
- Posts by Member Search: 'alcastro'