- Search Energy EXCH
- 13 Results
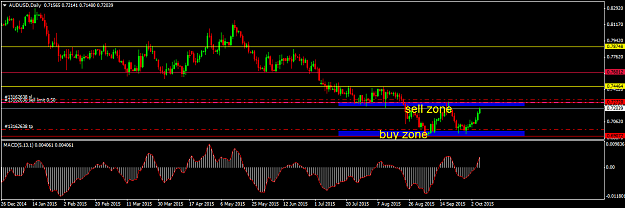
- actorial replied Oct 28, 2015
Breakeven again on the previous long position. Sell the Rumors buy the fact, this rule seem to always apply for me. I had re-entered my long position from 61.8 fib support. Target still remain as 0.7500 Stop loss is set below the 61.8 line. ( i ...
AUD/USD
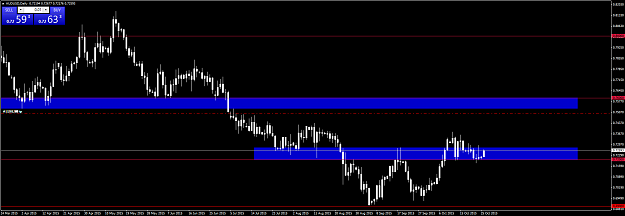
- actorial replied Oct 26, 2015
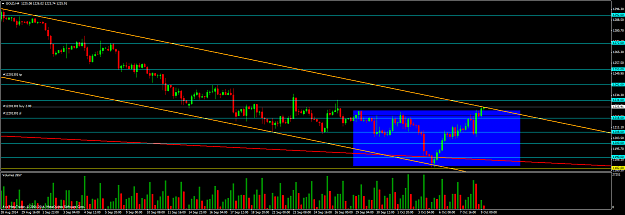
image This is my working chart. Respecting the Daily Double Bottom. Upper blue zone be the selling zone and the lower blue zone which we are in now is the buying zone. Realized I did not share my chart work before I started sharing opinion. Cheers!
AUD/USD
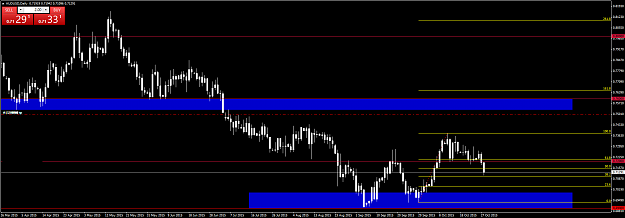
- actorial replied Oct 7, 2015
image All long out closed from 0.69900 to 0.72120 Set Sell Limit As seen in the picture attached, The blue areas are my sell zone and buy zone. Breaking of either will determine the trend. Just my very simple trading plan and Daily trading. Cheers ...
AUD/USD
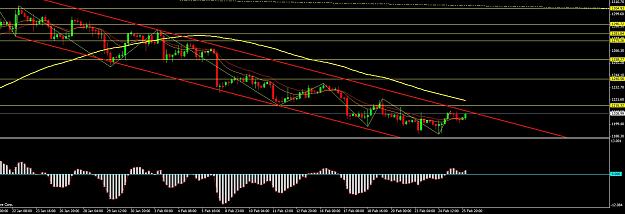
- actorial replied Feb 25, 2015
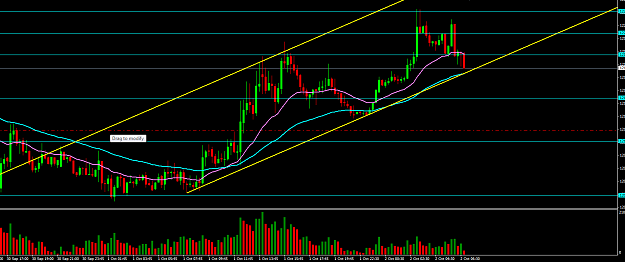
Waiting for price to reach top of channel and will enter Sell. Around 1211-1212 zone Target TP will be 1183 area. SL 1225 If price fall below 1183, 1140 range is possible to my point of view. Picture say a thousand words for my analysis. image
Only Gold!
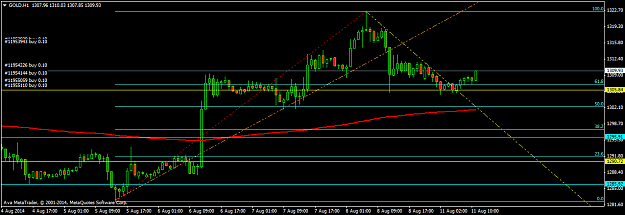
- actorial replied Oct 9, 2014
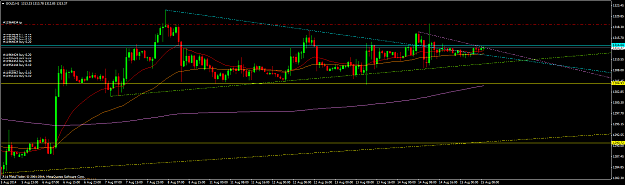
image IMHO Inverted Head and shoulder last 4H candle had broken the shoulder line. currently testing channel top but it doesnt seem like there is a line to hold. Price should be heading toward 1253 area. Bull is taking the run for awhile now.
Only Gold!
- actorial replied Oct 2, 2014
Really look forward for Gold to break downwards now..... A double top and crossed 1218. previous Head and shoulder was ignored totally although it form very nicely. 15mins chart image
Only Gold!
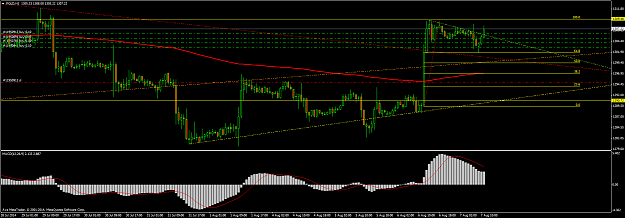
- actorial replied Aug 15, 2014
image 1314 seem to be holding the price really well. Got to break it to climb any higher
Only Gold!
- actorial replied Aug 15, 2014
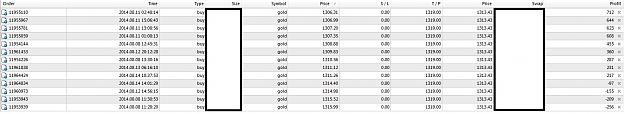
image Profit are in pips Im leaving for holiday in 5 hours time.... so im planning to close all position and have a peace of mind during my holiday of 2 weeks. Come on gold!
Only Gold!
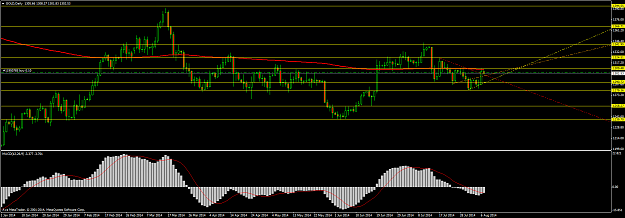
- actorial replied Aug 13, 2014
image Mr Gold got to break the blue line above to proceed further
Only Gold!
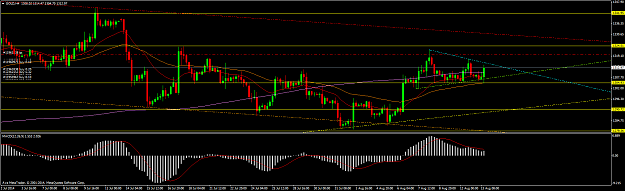
- actorial replied Aug 11, 2014
image - Fibo bounce off at 38.2 ( both 1H and 4H chart ) - hourly downward trend line broken ( seem legit ) Price heading for 1324 atleast? Can someone advise me on my analysis?
Only Gold!
- actorial replied Aug 7, 2014
Everything in my chart run according to my own analysis. Long go the Gold! image
Only Gold!
- actorial replied Aug 7, 2014
My indicator list are: 233 EMA ( Bar above buy, below sell ) <= subjective 12, 26, 9 MACD ( line above bar sell, vice versa ) Trendline Drawn by myself Support and Resistant lines marked by myself Thats all I use
Only Gold! go with the statistic. Below is ...
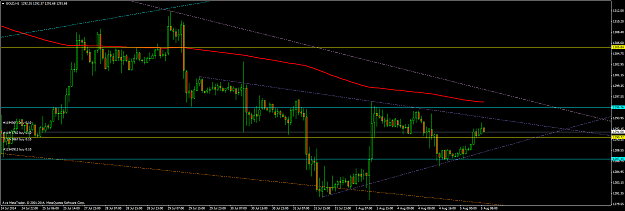
- actorial replied Aug 5, 2014
Blue Horizontal line being temporary resistant line and Yellow being strong resistant line. This is how I look at my chart. Would love to heard from anyone regards to my thinking. Please advise if possible. Im on long @ 1288, 1290, 1291, 1292 image
Only Gold!
- Posts by Member Search: 'actorial'