- Search Energy EXCH
- 67 Results (2 Threads , 65 Replies )
-
 Xrin replied Nov 15, 2018
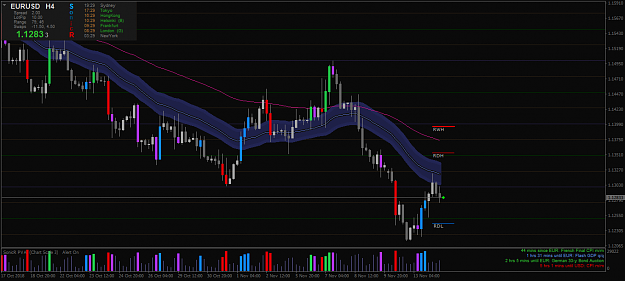
strong uptrend for EURUSD though in the Daily chart it is still the downtrend image
EURUSD
- Xrin replied Nov 14, 2018
Continuing downtrend unless the price cross daily high level of 1.1353 image
EURUSD
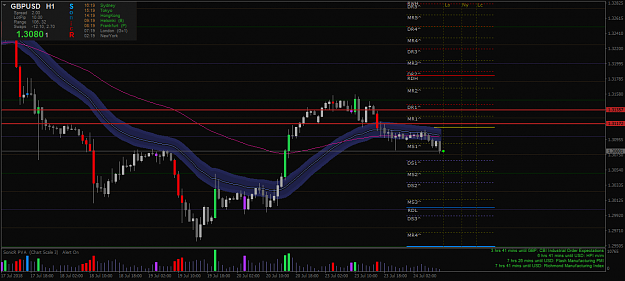
- Xrin replied Jul 24, 2018
Analysis: market has initiated down trend & unless it cross upper band levels keep trading only short trades. Current trend: Strong down trend upper band level 1: 1.3117 upper band level 2: 1.3135 Time: July 24, 12:17 PM (UTC+6) image
GBPUSD Market Overview
- Xrin replied Jul 24, 2018
Analysis: market has initiated down trend & unless it cross upper band levels keep trading only short trades. Current trend: Strong down trend upper band level 1: 1.1706 upper band level 2: 1.1729 Time: July 24, 12:15 PM (UTC+6) image
EURUSD Market Overview

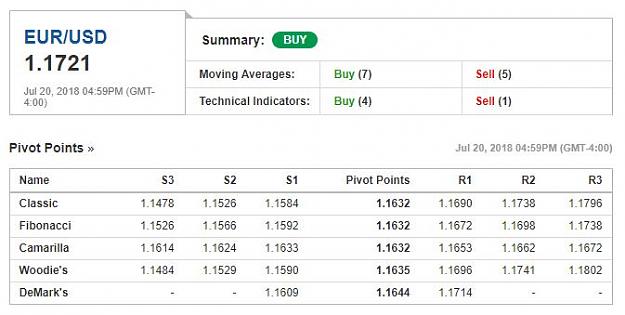
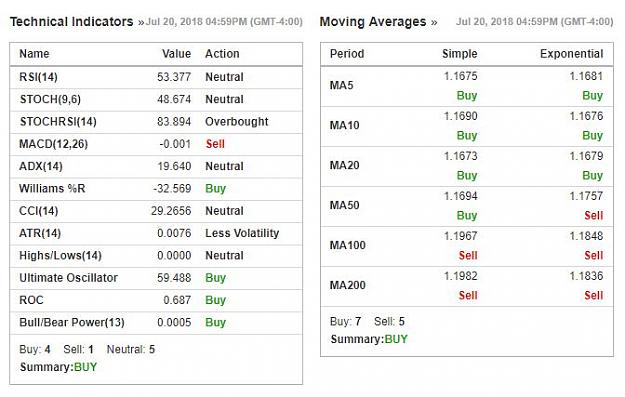
- Xrin replied Jul 21, 2018
Trading Chart: Daily time frame Pivot Points: Support & Resistance Technical Indicators: 13 Summary: Weak up trend Time: July 21, 2018 image image
EURUSD Market Overview
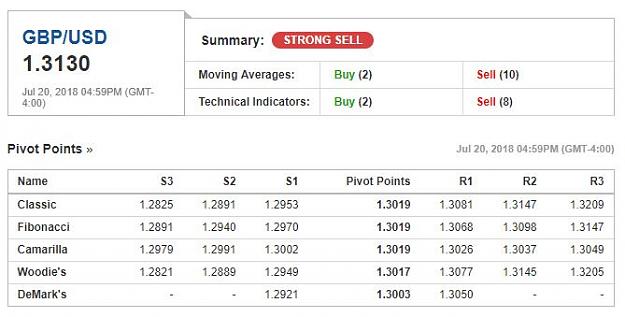
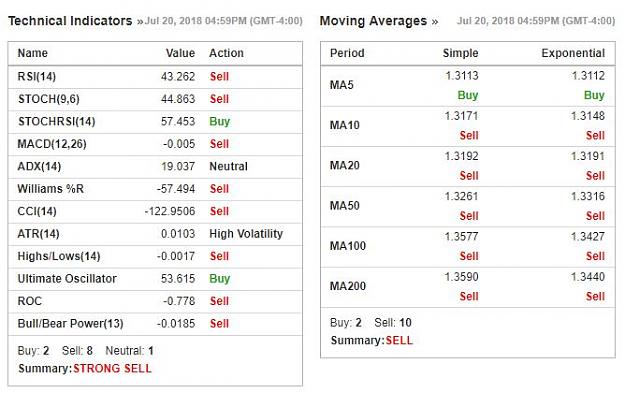
- Xrin replied Jul 21, 2018
Trading Chart: Daily time frame Pivot Points: Support & Resistance Technical Indicators: 13 Summary: Strong down trend Time: July 21, 2018 image image
GBPUSD Market Overview
- Xrin replied Jul 21, 2018
Analysis: before market closed, price still has strong up trend & if price cross lower band levels then quit from all trades. Current trend: Strong up trend lower band level 1: 1.3084 lower band level 2: 1.3052 Time: July 21, 11:22 AM (UTC+6) image
GBPUSD Market Overview
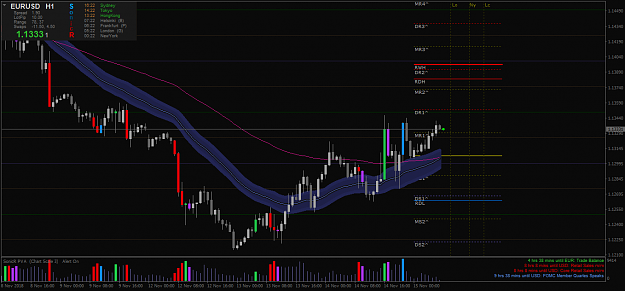
- Xrin replied Jul 21, 2018
Analysis: before market closed, price still has strong up trend & if price cross lower band levels then quit from all trades. Current trend: Strong up trend lower band level 1: 1.1680 lower band level 2: 1.1654 Time: July 21, 11:18 AM (UTC+6) image
EURUSD Market Overview
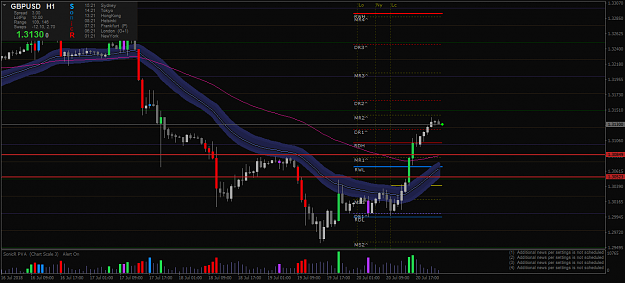
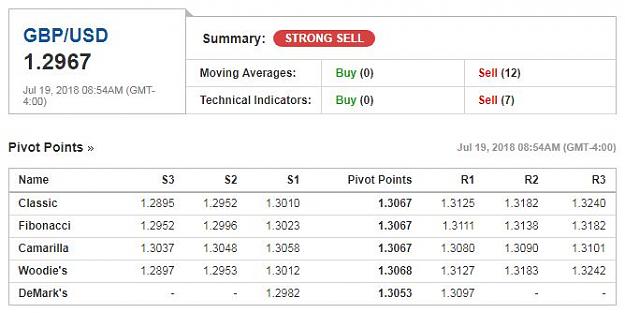
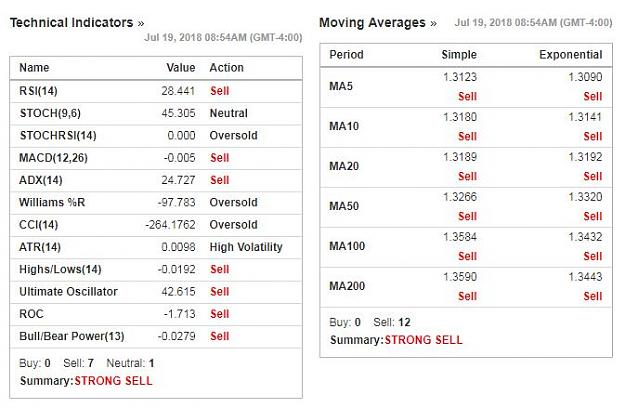
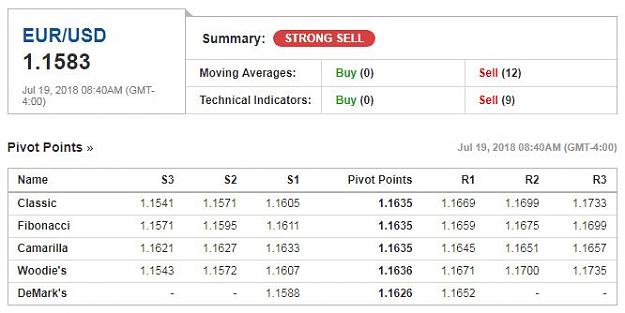
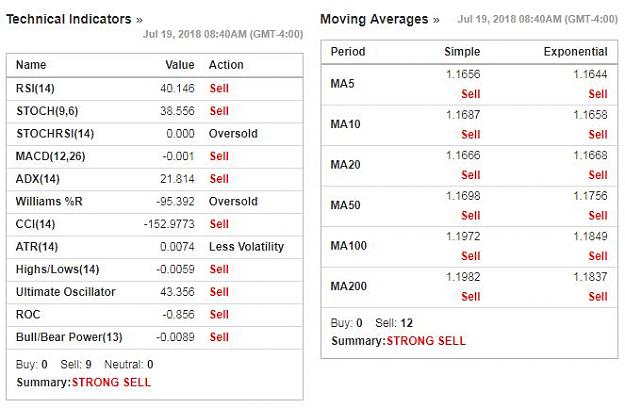
- Xrin replied Jul 19, 2018
Trading Chart: Daily time frame Pivot Points: Support & Resistance Technical Indicators: 13 Summary: Strong down trend Time: July 19, 2018 image image
GBPUSD Market Overview
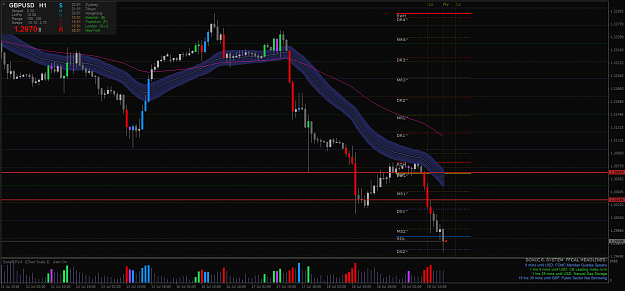
- Xrin replied Jul 19, 2018
Analysis: price has very strong down trend, until it cross upper band levels current trend will continue. Current trend: Strong down trend upper band level 1: 1.3028 upper band level 2: 1.3067 Time: July 19, 6:50 PM (UTC+6) image
GBPUSD Market Overview
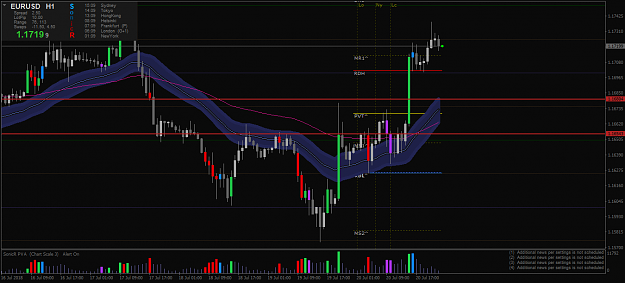
- Xrin replied Jul 19, 2018
Trading Chart: Daily time frame Pivot Points: Support & Resistance Technical Indicators: 13 Summary: Strong down trend Time: July 19, 2018 image image
EURUSD Market Overview
- Xrin replied Jul 19, 2018
Analysis: price has very strong down trend, until it cross upper band levels current trend will continue. Current trend: Strong down trend upper band level 1: 1.1619 upper band level 2: 1.1632 Time: July 19, 6:29 PM (UTC+6) Follow our thread: EURUSD ...
EURUSD
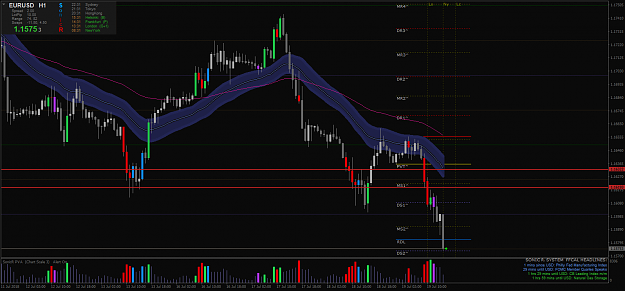
- Xrin replied Jul 19, 2018
Analysis: price has very strong down trend, until it cross upper band levels current trend will continue. Current trend: Strong down trend upper band level 1: 1.1619 upper band level 2: 1.1632 Time: July 19, 6:29 PM (UTC+6) image
EURUSD Market Overview

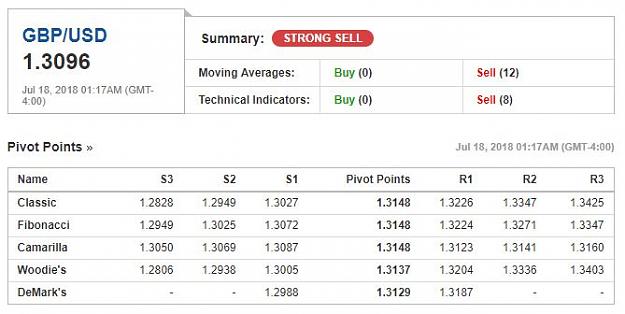
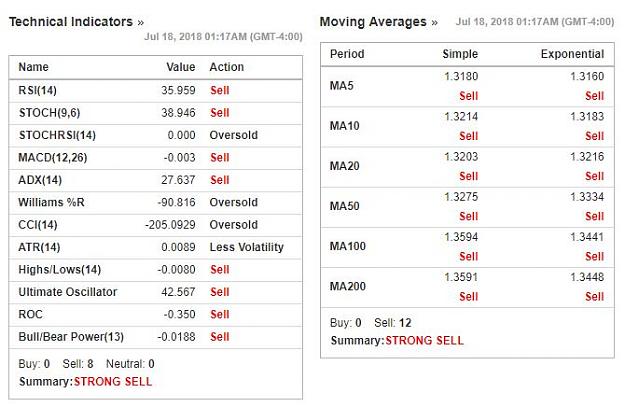
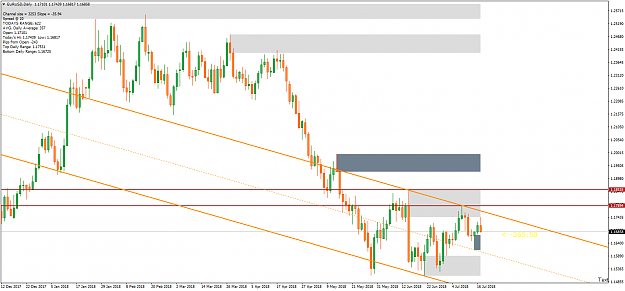
- Xrin replied Jul 18, 2018
Trading Chart: Daily time frame Pivot Points: Support & Resistance Technical Indicators: 13 Summary: Strong down trend Time: July 18, 2018 image image
GBPUSD Market Overview
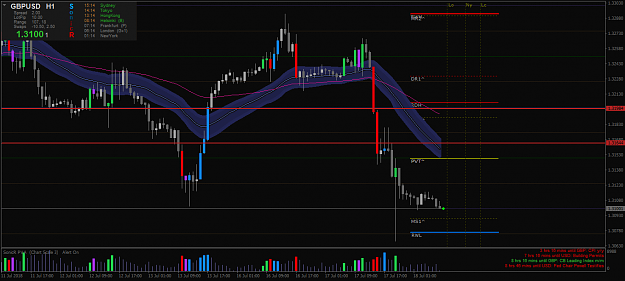
- Xrin replied Jul 18, 2018
Analysis: price has strong down trend, until it cross upper band levels current trend will continue. Current trend: Strong down trend upper band level 1: 1.3164 upper band level 2: 1.3198 Time: July 18, 11:12 AM (UTC+6) image
GBPUSD Market Overview
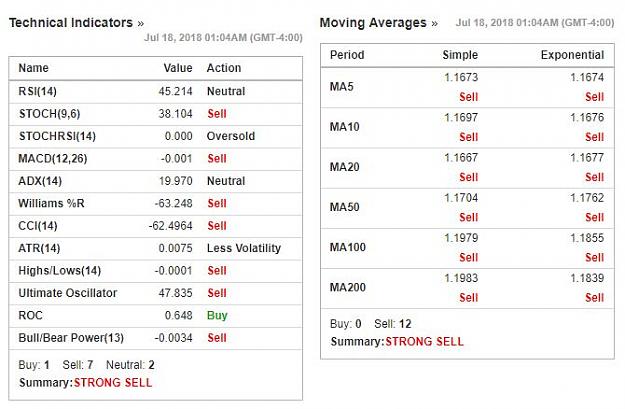
- Xrin replied Jul 18, 2018
Trading Chart: Daily time frame Pivot Points: Support & Resistance Technical Indicators: 13 Summary: Strong down trend Time: July 18, 2018 image image
EURUSD Market Overview
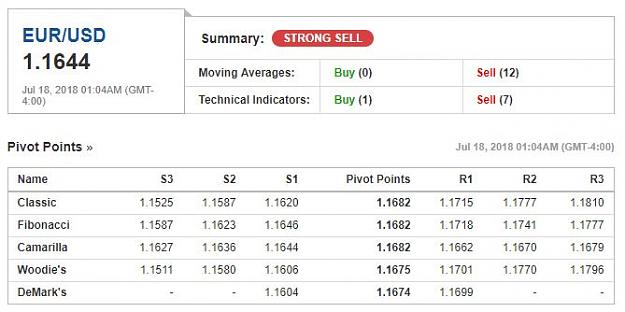
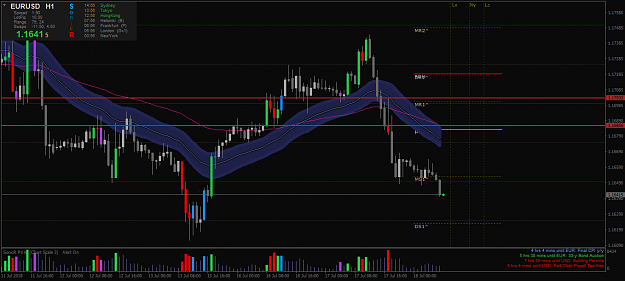
- Xrin replied Jul 18, 2018
Analysis: price has strong down trend, until it cross upper band levels current trend will continue. Current trend: Strong down trend upper band level 1: 1.1685 upper band level 2: 1.1703 Time: July 18, 10:57 AM (UTC+6) image
EURUSD Market Overview
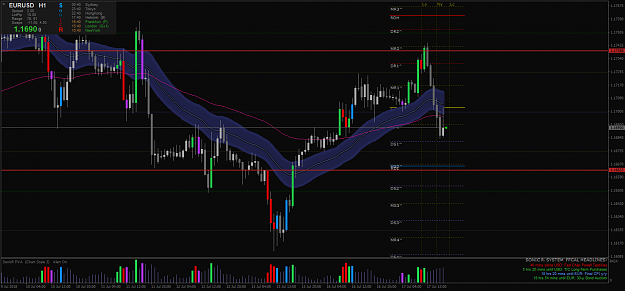
- Xrin replied Jul 17, 2018
Long term analysis: price has down trend for long term unless it cross resistance levels. resistance level 1: 1.1789 resistance level 2: 1.1853 Time: July 17, 8:54 PM (UTC+6) image
EURUSD
- Xrin replied Jul 17, 2018
Long term analysis: price has down trend for long term unless it cross resistance levels. resistance level 1: 1.1789 resistance level 2: 1.1853 Time: July 17, 8:54 PM (UTC+6) image
EURUSD Market Overview

- Xrin replied Jul 17, 2018
Analysis: price is ranging right now, its better to stay away from market until price hit one of the lower or upper band level & start a strong trend. Current trend: Market is ranging upper band level: 1.1738 lower band level: 1.1663 Time: July 17, ...
EURUSD