- Search Energy EXCH
- 46 Results (2 Threads , 44 Replies )
-
 WHTenn replied Jan 25, 2008
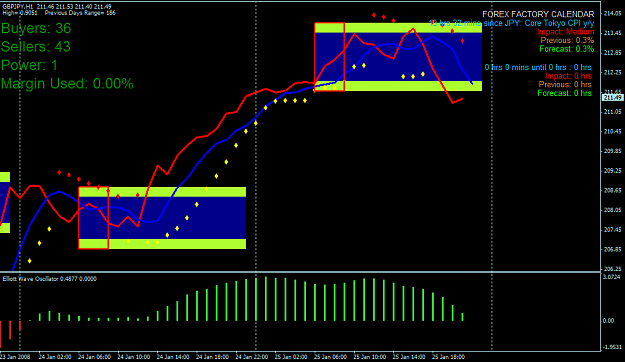
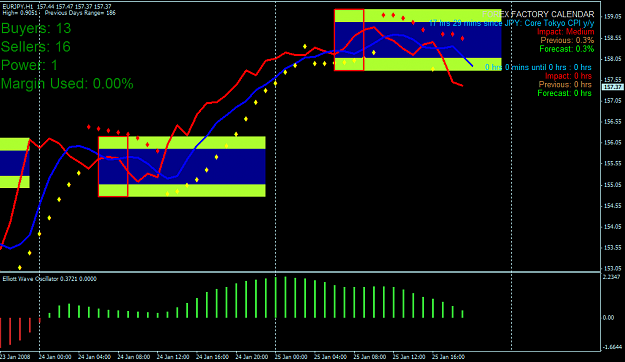
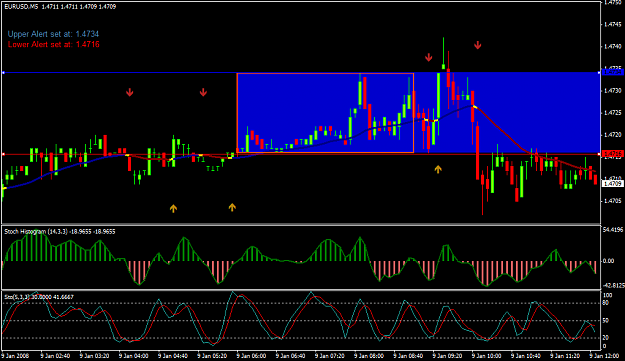
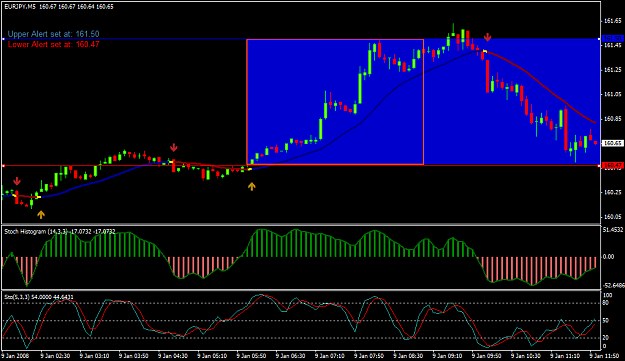
You also need to download the breakout indicator. Attached are my charts for EUR/USD and EUR/JPY for this system. Good Luck
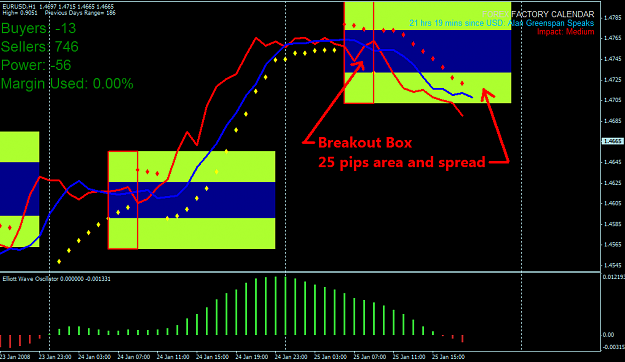
Breakout + Spread!! Sure!!!
- WHTenn replied Jan 16, 2008
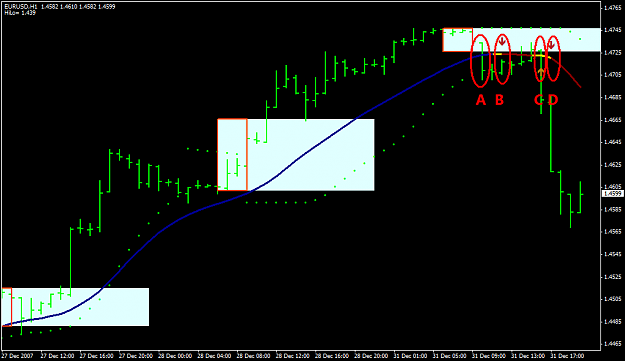
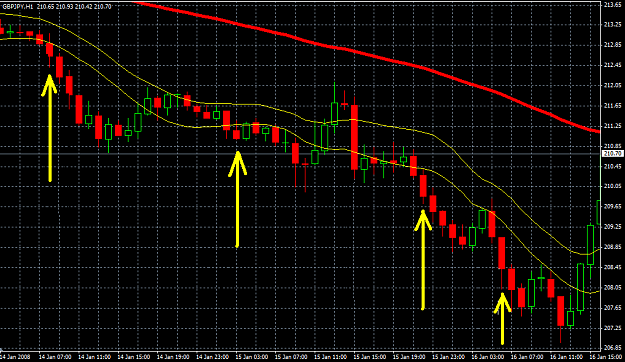
The last candle? Do you mean the first candle that closes below the 13 SMA lines? JR2007, do you agree with entry points?
13 low 13 high MA 1 hr chart System
- WHTenn replied Jan 15, 2008
I added this Parabolic SAR Color-Alert to my chart. I found these here url thanks to MagnumFreak. This guy is amazing! A real asset to this forum.
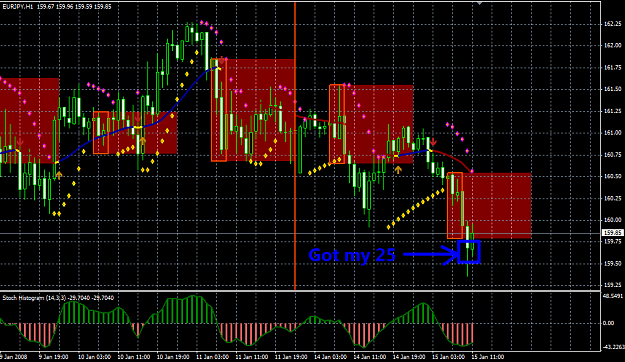
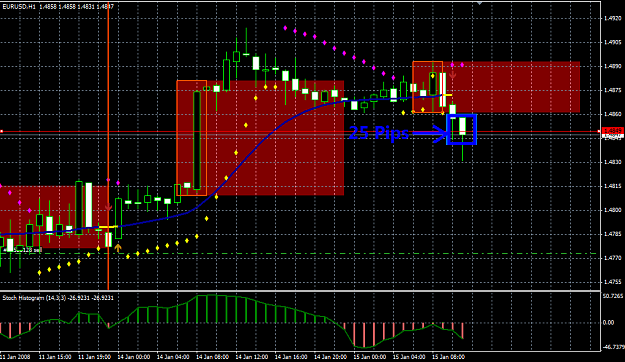
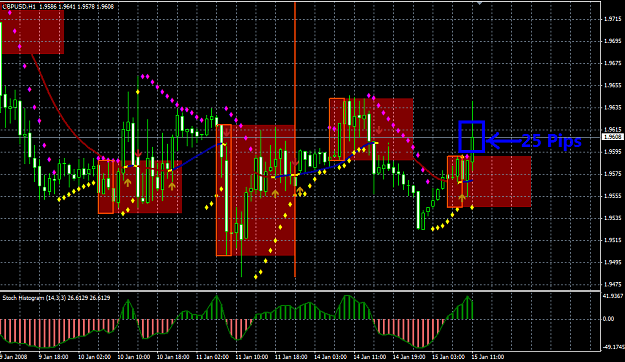
Breakout + Spread!! Sure!!! I easily picked up my 25 pips on each of my three currency pairs early this morning. ...
- WHTenn replied Jan 9, 2008
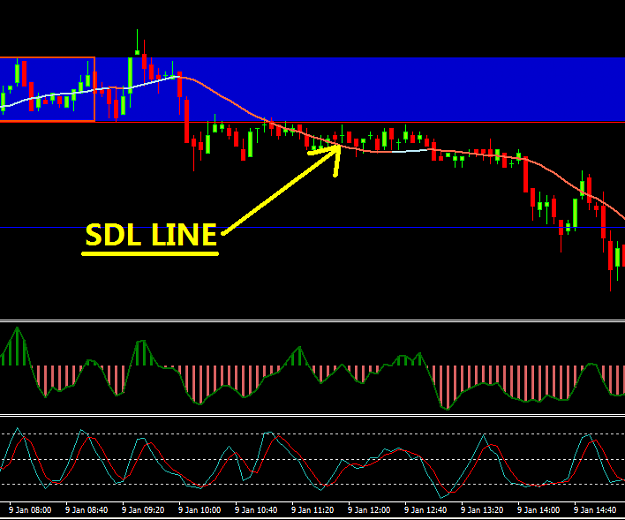
This is a picture of the SDL. I think what jajajabla wanted was an alarm that goes off when the line changes color.
sound for slope
- WHTenn replied Jan 9, 2008
Make a template. Instructions in link below. You can use the template for different charts and also transfer them to another account, as long as you have the same indicators. Also use the help button for instructions. www.metaquotes.net
Trtansfer Charts to another Profile??
- WHTenn replied Jan 9, 2008
The 3 pairs I am trading are the EUR/JPY, GBP/USD and EUR/USD. Time frames I traded the above charts with are the 5M. Since your using a different system and a different broker, you need to find the time of the London open on your system. The first ...
Breakout + Spread!! Sure!!!

- WHTenn replied Jan 9, 2008
Two more indicators and template on this post. This is the Eur/USD 5 Min chart
Breakout + Spread!! Sure!!!
- WHTenn replied Jan 9, 2008
Beachbum's great posting made me look at a different approach to my system. I also changed a few indicators and added a few thanks to the great additions by the traders on this thread. I am including my Template and indicators that I use. With the ...
Breakout + Spread!! Sure!!!
- WHTenn replied Jan 8, 2008
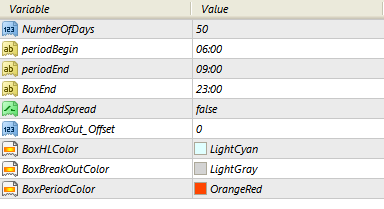
Here you go, exact settings my friend. I got my pips with GBP/JPY and EUR/JPY. Waiting for my EUR/USD to come thru.
Breakout + Spread!! Sure!!!
- WHTenn replied Jan 8, 2008
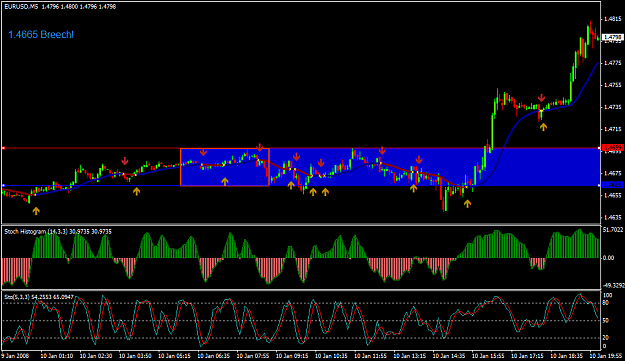
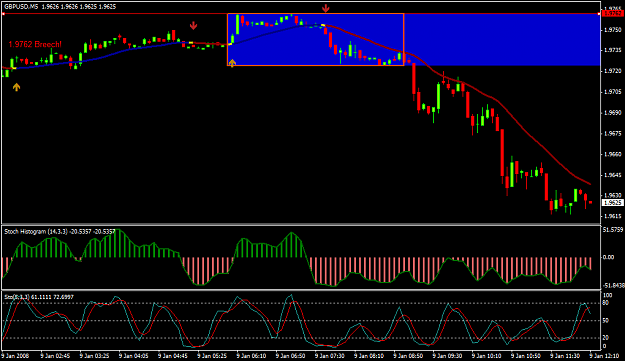
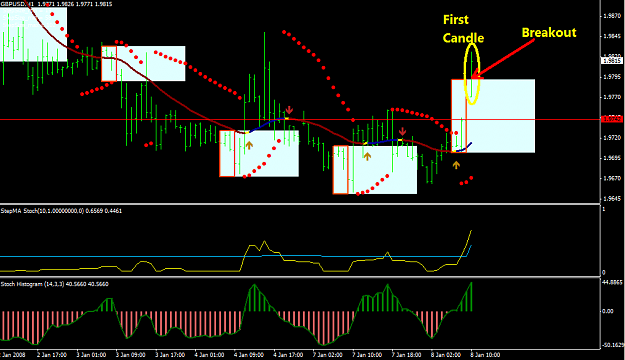
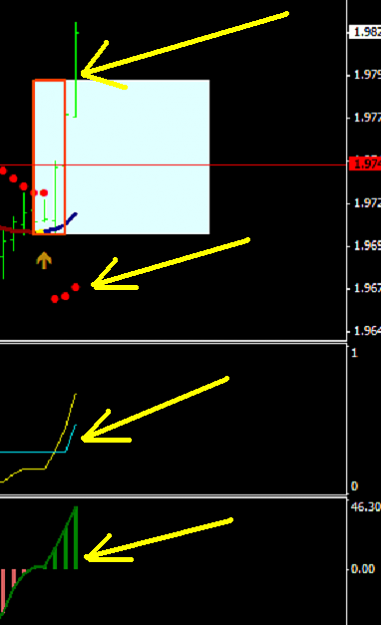
Upper Pic... The first candle, (circled in yellow) that breaks outside of the red box is the one you start monitoring. When it breaks the white box, (red arrow) you take the trade. This is the actual trade for GBP/USD occuring at time of posting... ...
Breakout + Spread!! Sure!!!
- WHTenn replied Jan 8, 2008
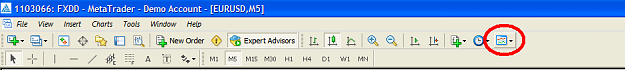
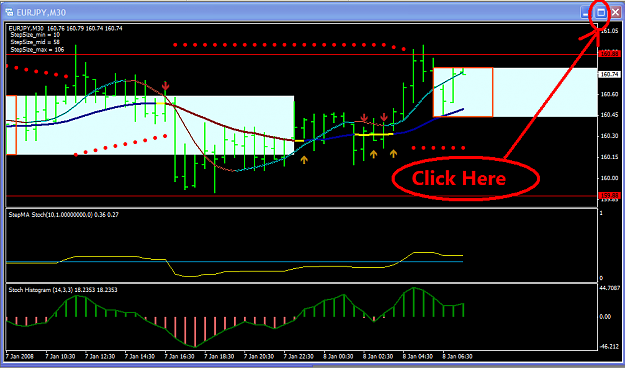
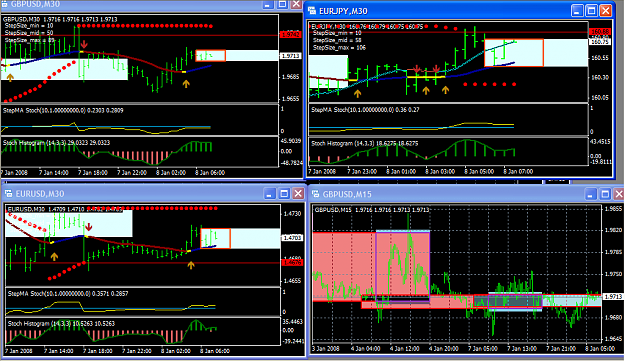
Yes you can actually Set up your 4 charts then click on location pointed in arrow. You can change Horizontal and Vertical sizing of charts by moving mouse to edges of charts, click and hold mouse while resizing. I hope that this helps. A good site ...
Can we add 3-4 Currency Pair chart in 1 Window ?
- WHTenn replied Jan 6, 2008
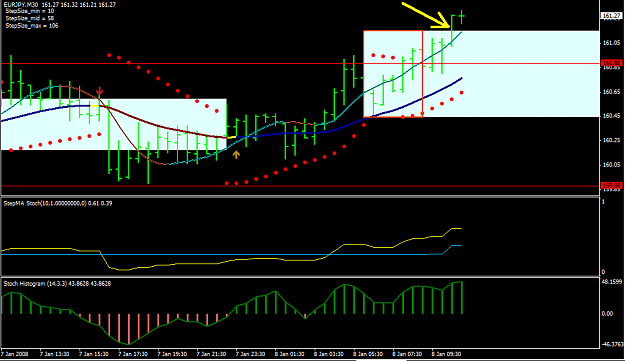
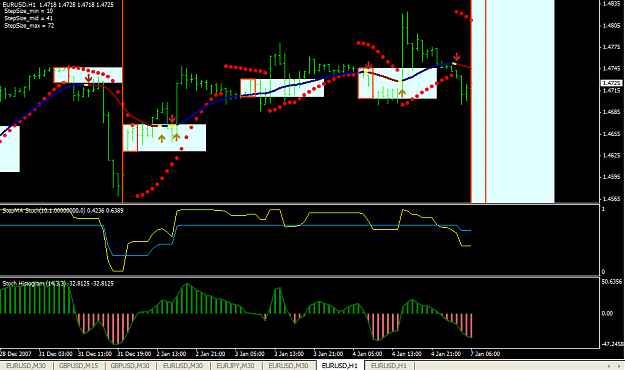
Check out these two indicators that I am testing with this system. 1) Stoch Histogarm 2) StepMaStoch v1.1 I am attaching both to this post. Attach and play with them.
Breakout + Spread!! Sure!!!
- WHTenn replied Jan 5, 2008
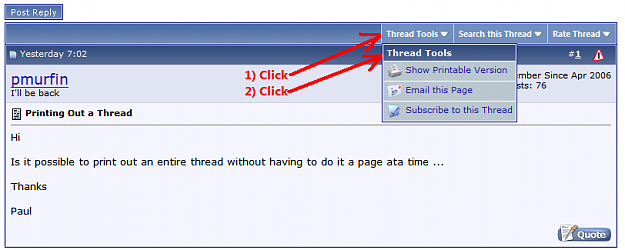
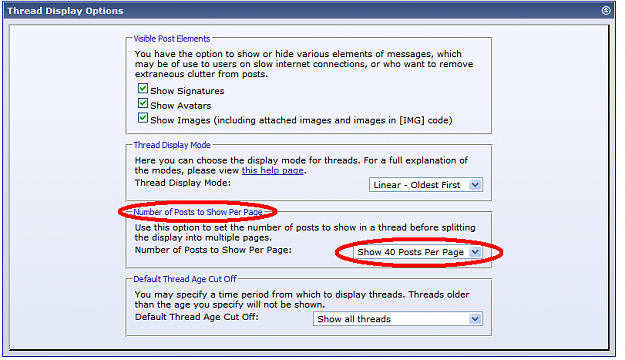
I hope that this helps. I was not sure what you meant by one page at a time.
Printing Out a Thread
- WHTenn replied Jan 4, 2008
Oil vs. Currency Market — Oil is one of the most traded commodities in the world. Consequently, Its change has a ripple effect on many economies and countries. When discussing oil, most people refer to the Middle East and their vast oil ...
How to avoid stopp loss...anyone doing that?
- WHTenn replied Jan 1, 2008
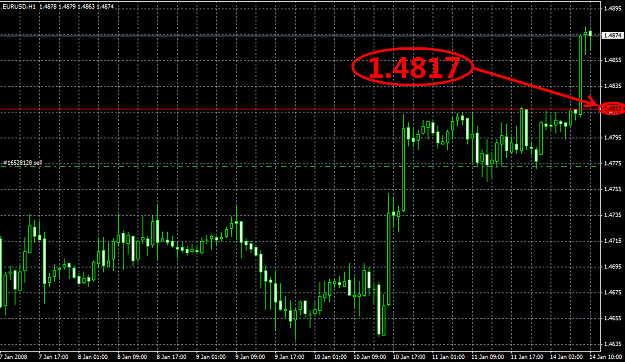
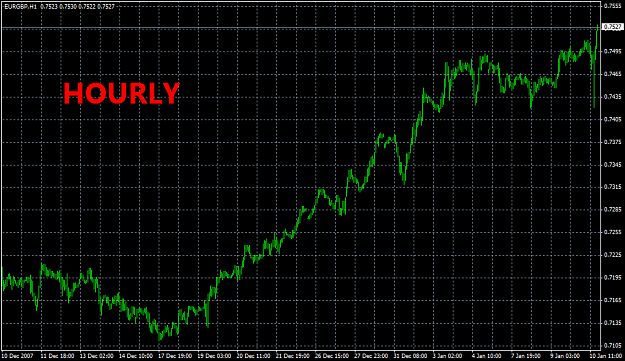
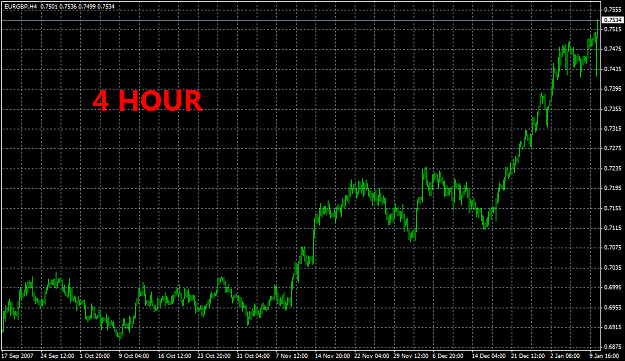
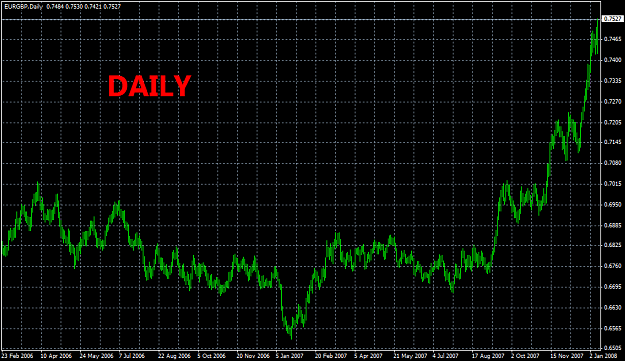
Here is a good chart to go over — I look at the overall trend using 4hr and daily charts. I then look at the xpMA indicator for direction and then Parabolic SAR. Yesterdays chart would be an excellent example of what to do when in doubt rather ...
Breakout + Spread!! Sure!!!